This is an Application Brief and does not contain a detailed Experimental section.
Here we demonstrate the impact of enabling Intelligent Data Capture on data quality and file size for intact mAb and intact subunit analysis.
High Resolution Mass Spectrometry (HRMS) analysis of intact proteins provides a rich dataset from which both quantitative and qualitative information can be derived. At the same time, managing these large datasets can be a challenge. The Vion IMS-QTof Mass Spectrometer has an option in data acquisition called “Intelligent Data Capture” (IDC). IDC employs adaptive background subtraction and data sweeping during data acquisition to remove background and noise peaks, resulting in improved signal to noise and reduced file sizes. A detailed description of IDC is explained in white paper “Intelligent Data Capture: Real-Time Noise Reduction for HRMS”.¹ In this application brief, the benefits of IDC for intact mass analysis of mAbs and subunits are presented.
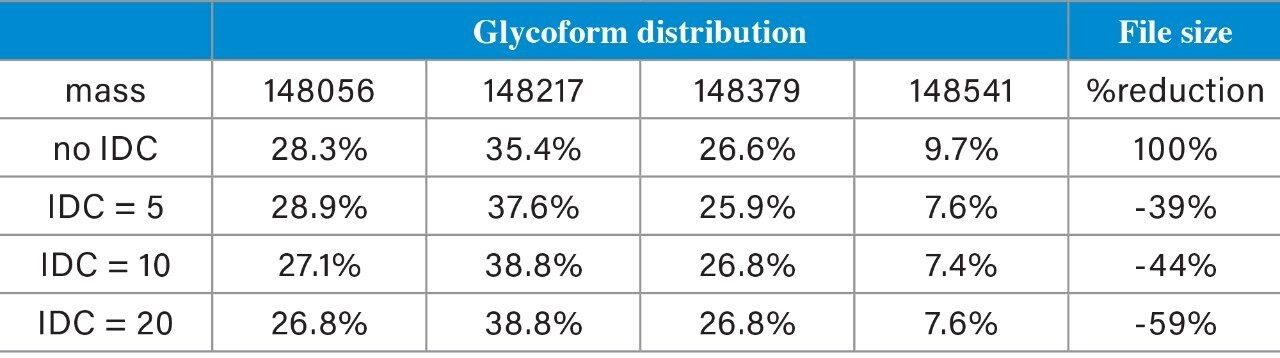
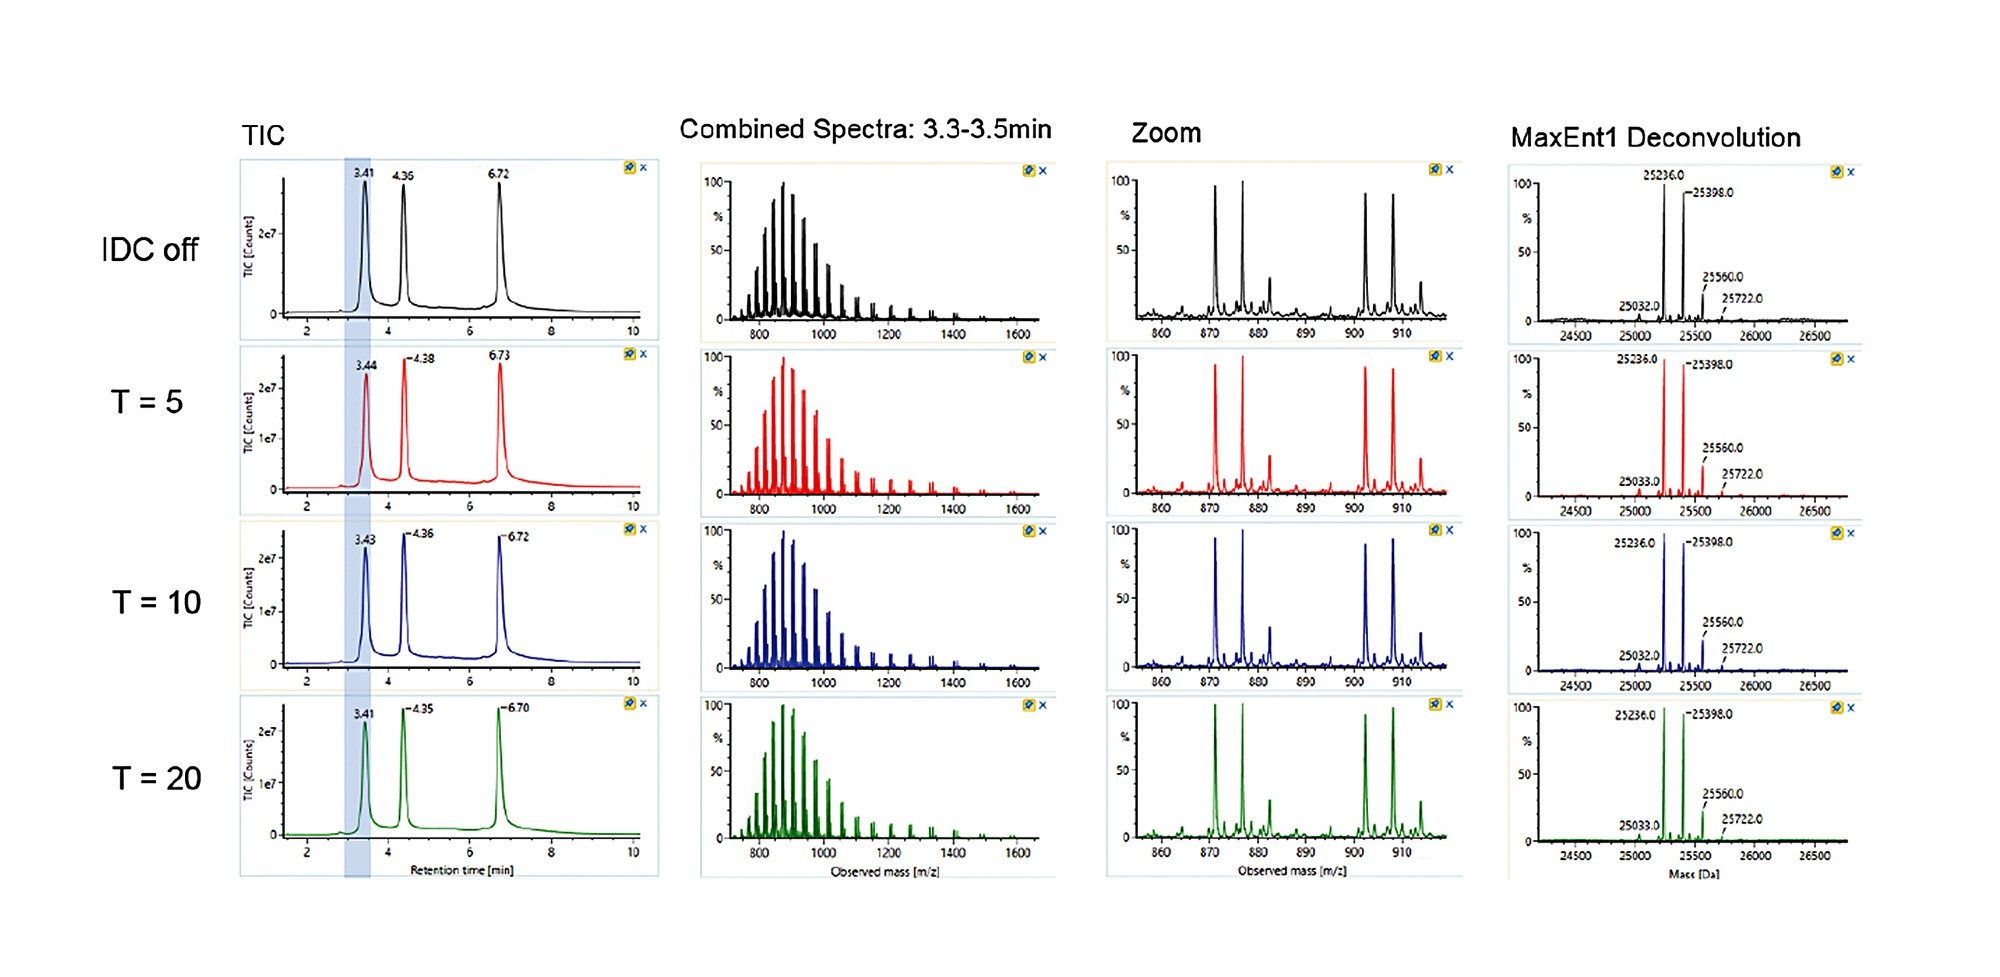
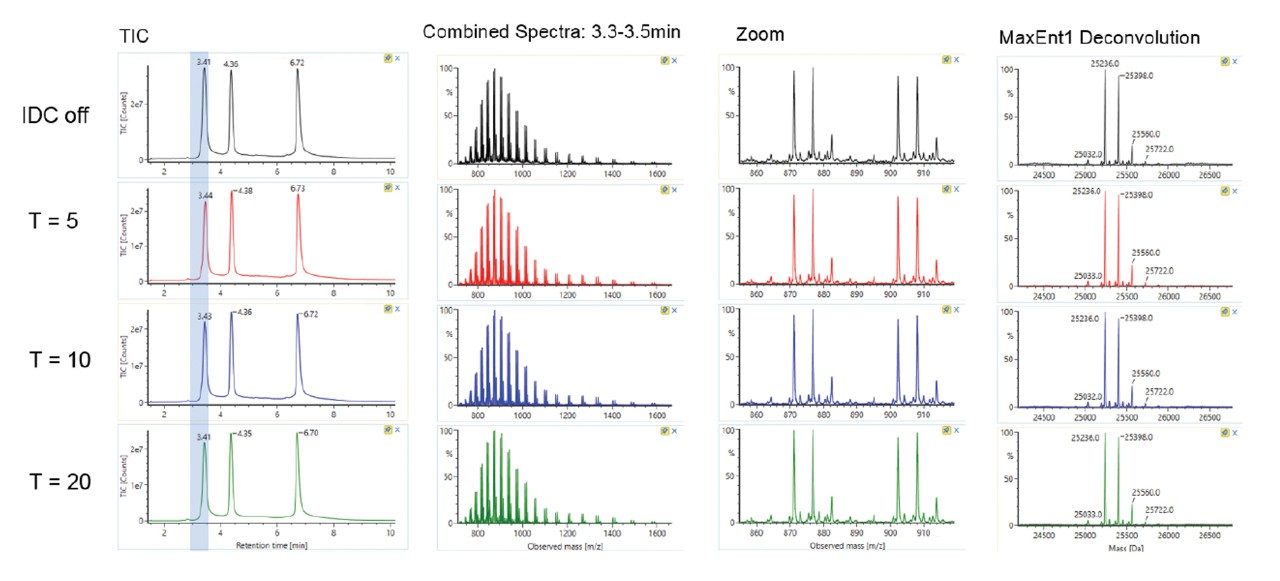
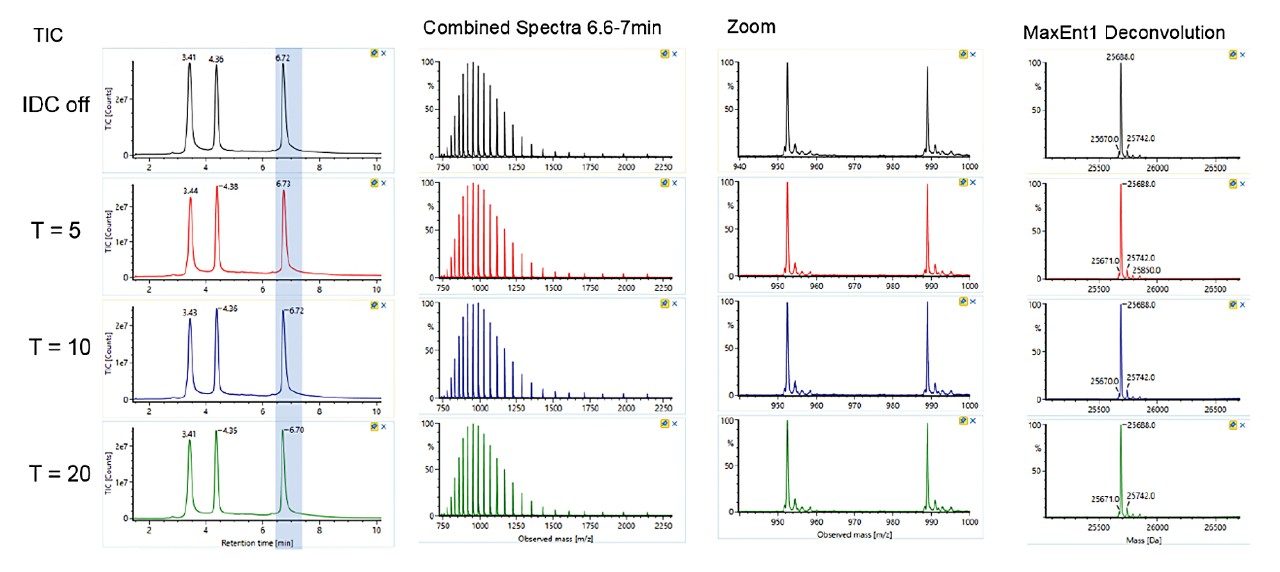
Trastuzumab (100 µg/mL) in ammonium acetate/BSA solution was prepared. Data was acquired by ESI-TOF-MS (+ve full scan mode) with or without IDC enabled. IDC intensity threshold (counts) of 5, 10, and 20 were evaluated. LC-MS conditions used for the acquisition were previously reported.² The observed and deconvoluted spectrum are shown in Figure 1. Results show that the protein charge state distribution, glycosylation profile, and deconvoluted spectra are essentially the same when comparing data acquired with and without IDC enabled. Acquiring with the default IDC counts of 5, there is a significant drop in Tof Valley peak from 15–20% to ~5%, resulting in near baseline separation of the glycoforms. Glycoform percent distribution and data file size reduction corresponding to each of the IDC counts are summarized in Table 1. Increasing the IDC counts from the default 5 to 20, does not significantly change the calculated glycoform distribution, nor the Tof valley profiles indicating the default counts is optimal. Similarly, comparing file sizes across IDC modes, a file size reduction of 39% was realized using the default IDC counts of 5, increasing the IDC counts to 10, and 20, reduced the file size further to 45% and 59% respectively. Overall, significant file size reduction was realized using IDC-enabled data acquisition with improved Tof valley profile and minimal effect on glycoform distributions.
Waters NIST mAb Subunit Standard (p/n: 186008927) ~100 µg/mL in H2O was prepared. Data was acquired using ESI-TOF-MS (+ve full scan mode) with and without IDC enabled. IDC counts of 5, 10, and 20 were evaluated. LC-MS experimental conditions are described in a separate application note.³ The observed and deconvoluted mass spectra are shown in Figures 2–4 for each of the subunit scFc, LC and Fd of the reduced mAb. Results showed that Data Integrity was maintained with IDC enabled and across different IDC counts. There is significant file size reduction, at the default IDC counts of 5, the file size was reduced by 45%. Increasing the IDC counts to 10 and 20, reduced the file size further by 66 and 80% respectively.
Enabling IDC for data acquisition is described for intact mass analysis of trastuzumab and NIST mAb subunits. Results show significant file size reductions of between 40 and 80% while maintaining mass spectral quality. The default IDC counts of 5 is optimal for routine acquisitions. The implementation of IDC during acquisition is flexible, employing either a default counts or user entered through promotable parameters. Overall, this implementation and resulting reduced file size will help to improve overall processing efficiencies of general LC-MS analysis.
The IDC option can be found in Analysis Method on the page “Instruments_Instrument_Method Configuration_Vion IMS QTof_Experiment”. An example of the page is shown in Figure A. Clicking the check box will toggle it on and off. The default IDC counts is 5. When a different IDC counts is desired, promotable parameters can be used and is described in the next section. The IDC is available for all analysis types and all acquisition modes.
When desired, IDC can be turned on or off and the counts varied from injection to injection. To enable this function, go to Analysis Method_Sample List_Sample List Setup, clicking on “Add/Remove Column” will display the dialog box shown in Figure B. Choose “Intelligent Data Capture” and “Intelligent Data Capture Intensity Threshold (counts) will add these two columns to the list. IDC selection and IDC counts entered on these columns will override default counts in Figure A.
720006674, September 2019