• Application Note

Evaluating the Impact of LC System Dispersion on the Size-Exclusion Chromatography Analysis of Proteins

Evaluating the Impact of LC System Dispersion on the Size-Exclusion Chromatography Analysis of Proteins

  • Stephan M. Koza
  • Corey Reed
  • Weibin Chen
  • Waters Corporation

Abstract

This application note details and discuss the origins and measurement of extra-column dispersion, and demonstrate the impact that extra-column dispersion has on the efficiency of SEC separations.

Benefits

  • Understanding the measurement of LC system dispersion
  • An educational and systematic demonstration of the impact of LC system dispersion on SEC-based protein separations
  • Guidance for selecting the optimal SEC column configuration based on the LC systems to be used and the analytical method requirements including resolution, sensitivity, reproducibility, and transferability

Introduction

Size-exclusion chromatography (SEC) is the predominant method used for the assessment of non-covalent protein aggregation (high molecular weight species [HMWS]) in recombinant biotherapeutic protein and peptide products.1 In the application note “Impact of LC System Dispersion on the Size-Exclusion Chromatography Analysis of Monoclonal IgG Antibody Aggregates and Fragments: Selecting the Optimal Column Configuration for Your Method” (p/n: 720006336EN), we presented an in-depth evaluation of the SEC analysis of monoclonal antibody (mAb) aggregates (HMWS) and fragments (LMWS), and the effect that extra-column dispersion has on that separation. This application note is a companion piece to that publication with the intent of providing a more detailed and generally applicable discussion of extra-column dispersion and SEC column selection. We have also included additional instructive information and data regarding the measurement of extra-column dispersion and the impact that extra-column dispersion has on the SEC separation of proteins. In doing so, we have also presented some of the same data and figures in both application notes in order to provide publications that can be read and referred to independently.

Extra-column dispersion can be considered as the increase in the volume of an injected sample that occurs as it travels through an LC system’s flow-path without a column. Consequently, as the volume of this dispersion increases in proportion to the volume of the separated peaks, the resolution of the SEC separation will diminish.

A brief review of the history of SEC protein separations will help explain why LC system dispersion has had a greater impact on the quality of modern SEC separations. In 1977, the Tosoh Corporation (Japan) introduced a diol-bonded silica-based TSKgel SW series of SEC columns for the analysis of proteins which were packed with 10 to 13 μm particle sizes. The SW series of columns and the 5 to 8 μm particle size SWXL series of columns introduced by Tosoh 10 years later were typically packed in column hardware with internal diameters (I.D.) of 7.5 mm or greater and in 30 cm lengths. With these columns, the generated peak volumes were sufficiently large so that the measurable separation efficiencies were not significantly impacted by extra-column dispersion. While these TSKgel SW and SWXL columns were the predominant column of choice for the analysis of biotherapeutic protein aggregation, the push toward higher sample throughput in recent years has resulted in the adoption of higher efficiency SEC columns with particle diameters of 2 μm and smaller. However, due to the use of shorter SEC column lengths made possible by use of these smaller and more efficient particles, column packing constraints have generally limited this hardware to internal diameters of 4.6 mm or smaller. Consequently, these smaller columns have significantly decreased packed bed volumes and higher efficiencies. This has resulted in a significant decrease in the peak volumes produced by these modern SEC columns such that the extra-column dispersion volume of a typical HPLC or UHPLC system is sufficiently large enough to cause a significant reduction in observed peak resolutions.2

This application note will detail the origins and measurement of extra-column dispersion and demonstrate the impact that extra-column dispersion has on the efficiency of SEC separations. We will conclude by summarizing useful considerations in the selection of an SEC particle size and column geometry for protein separations.

Experimental

Sample description

BEH200 SEC Protein Standard Mix (p/n: 186008476) was reconstituted in 500 μL of SEC mobile phase to yield the following:

The mAb sample of rituximab (Rituxan) was used past expiry at an original concentration of ~21 mg/mL.

The mAb sample of trastuzumab (Herceptin) was used past expiry at a diluted (in water) concentration of 2.0 mg/mL.

Intact mAb Mass Check Standard (p/n: 186006552) was reconstituted in 500 μL of SEC mobile phase to yield a nominal concentration of 2 mg/mL.

Method conditions (unless noted otherwise):

LC conditions

Systems:

ACQUITY UPLC H-Class Bio

Detection:

ACQUITY UPLC TUV detector with 5 mm titanium flow cell

Wavelength:

280 nm

Columns:

ACQUITY UPLC Protein BEH SEC, 200 Å, 1.7 μm, 2.1 × 150 mm (p/n: 186008471)

ACQUITY UPLC Protein BEH SEC, 200 Å, 1.7 μm, 4.6 × 150 mm (p/n: 186005225)

ACQUITY UPLC Protein BEH SEC, 200 Å, 1.7 μm, 4.6 × 300 mm (p/n: 186005226)

XBridge Protein BEH SEC, 200 Å, 2.5 μm, 7.8 × 300 mm (p/n: 186009164)

XBridge Protein BEH SEC, 200 Å, 2.5 μm, 7.8 × 150 mm (p/n: 186009163)

XBridge Protein BEH SEC, 200 Å, 2.5 μm, 4.6 × 150 mm (p/n: 176004335)

XBridge Protein BEH SEC, 200 Å, 2.5 μm, 4.6 × 300 mm (p/n: 176004336)

XBridge Protein BEH SEC, 200 Å , 3.5 μm, 7.8 × 150 mm (p/n: 176003595)

XBridge Protein BEH SEC, 200 Å, 3.5 μm, 7.8 × 300 mm (p/n: 176003593)

Column temp.:

Ambient, ~22 °C

Sample temp.:

10 °C

Mobile phase A:

100 mM NaH2PO4

Mobile phase B:

100 mm Na2HPO4

Mobile phase C:

1.00 M NaCl

Mobile phase D:

H2O

Flow rates and injection volumes unless, otherwise noted:

All 0.2 μm sterile filtered and Auto•Blend Plus blended at 7.4% A, 12.6 % B, 35% C, and 45% D to yield 20 mm sodium phosphate, 350 mM NaCl, pH 6.8, unless otherwise noted.

Sample vials: Polypropylene 12 × 32 mm Screw Neck Vial, with Cap and PTFE/silicone Septum, 300 μL Volume (p/n:186002640) 

Data management

Chromatography software: Empower 3

Results and Discussion

Understanding and Measuring System Dispersion

One of the fundamentals of chromatography is that extra-column or system dispersion, which is the broadening of a chromatographic peak or band that does not occur within the packed chromatographic bed of the column, always has a deleterious effect on the resolution of a separation. Extra-column dispersion can be visualized by the experiment diagrammed in Figure 1 where the peak volume resulting from a relatively small injection volume of analyte is determined without a column installed in the LC system. For this discussion, we will measure this extra-column dispersion peak width in units of time (min) at 4.4% of the peak and then multiply by the flow rate (μL/min) to generate the extra-column dispersion volume (μL). Since a normal Gaussian distribution is five standard deviations wide at 4.4% of its maximum height (approximately 99% of the peak area), we will analogously refer to this calculated extra-column dispersion volume as 5σec. Historically, chromatographic peak dispersion or band broadening volumes have often been represented as the unit σ value, which in this case would be obtained by dividing the 5σ value by 5 and still be expressed in units of μL. Dispersion is also often represented as a variance (σ2), which is the square of the dispersion volume and has units of μL2 This nomenclature is analogous to the nomenclature used to describe statistical distributions where the square root of the variance is equal to the standard deviation of the distribution. Throughout this discussion we will most often refer to 5σ dispersion volumes which can be more easily visualized.

The approximate band broadening of a peak, σpeak, as it travels through an LC system and SEC column is shown in the following relationship where σPre-column, σColumn, and σPost-column, are the pre-column, on-column, and post-column dispersion volumes. 


(Equation 1)
Figure 1. Measurements of extra-column dispersion were carried out using 3:7 water:acetonitrile as a mobile phase at a 0.3 mL/min flow rate. The sample was 1 μL of 0.16 mg/mL caffeine in 1:9 water:acetonitrile. The UV absorbance was monitored at 273 nm at a sampling rate of 40 Hz.

An important consideration within this relationship is σPre-column, which occurs primarily in the injector and tubing connecting to the column inlet. The impact of σPre-column on σPeak is modulated by the retention factor (k') of the analyte.3 At high k' values, where the analyte binds strongly to the stationary phase, the analyte will re-focus at the head of the packed bed of the column which will minimize and may even eliminate the deleterious effect of pre-column band dispersion. Examples of gradient based protein separations where analyte k' values can be sufficiently high during sample loading such that pre-column dispersion is not a concern include affinity (e.g., Protein A), ion-exchange, and reversed-phase separations. Conversely, in ideal SEC separations, as there is no partitioning occurring between the protein and the packed SEC particle surface, k' will be effectively zero. The practical result of this is that for SEC separations, pre-column dispersion will equally degrade the quality of a separation as compared to post-column dispersion, and as a result σPeak can be calculated by the simplified expression: 

(Equation 2)

Where σec is the total extra-column band broadening and is indeed the value that we determine by the experiment diagrammed in Figure 1. Another important relationship to note in either Equation 3 or Equation 4 is that the dispersion volumes are squared prior to being added and σpeak is then obtained by taking the square root of the summation. This relationship magnifies the impact that the larger σ value has in the relationship.

We will briefly consider the causes of extra-column dispersion. We can visualize the LC flow path to be a series of tubes and mismatched internal diameter connections of those tubes. The predominant contributions of extra-column dispersion can be understood based on the Taylor-Aris equation which models dispersion in a length of open capillary tubing.

(Equation 3)

Where σ2 vol,tube is the contribution of a given tube to peak variance, L is tube length, rc is tube internal radius, F is flow rate, and Dm is the diffusion coefficient of the analyte. Of note is that σ2 vol,tube is proportional to the 4th power of tubing radius, which underscores the importance of minimizing the internal diameter of connection tubing. In addition, as Dm decreases for larger molecular weight analytes, σ2 vol,tube will increase proportionally. While dispersion in open tubing is typically the predominant contributor to band broadening, the presence of mismatched tube internal diameter connections is also important to consider.4

(Equation 4)

Where T2chamber is the peak variance that occurs at the mismatched interface, which is referred to as a diffusion chamber. Similarly to σ2, τ2 is represented in units of μL2 and is added to peak volume in the same way. A mismatched fluidic interface can create an unswept volume within the LC flow path which leads to increased peak tailing as the analyte must diffuse back to the flow path, as a result, we can visualize the strong, inverse squared dependence that T2 chamber has on Dm.

The measurement of extra-column dispersion (system band broadening) has been studied extensively.5 These measurements range from simply determining the peak widths to more involved mathematical approaches that include elaborate peak modeling and deconvolution algorithms.6 The need for these advanced methods are the result of chromatographic and extra-column dispersion peak shapes that deviate significantly from a normal or Gaussian distribution in their nature. While these more complex approaches are certainly more accurate with regards to estimating the actual system band broadening and thereby elucidating the actual chromatographic performance of a column they are not very amenable to a routine analytical laboratory setting. As part of this study, we compared the more commonly used and easily obtained result for 5σec dispersion volume as determined by direct peak width measurement at 4.4% of the peak height, and 5σec as determined by the second moment of the peak.

Specifically, for this study, a zero-dead volume (ZDV) union was used in place of the SEC column (Figure 1) and the broadening of a small injection volume of caffeine was evaluated. In addition to the standard configuration, we also evaluated additional configurations in which sample loops or combinations of sample loops ranging from adding an additional 5 μL to 60 μL to the flow path to increase the system dispersion volume (Figure 2). The direct measurement of the 5σec peak widths (peak width at 4.4% peak height) were then determined (Figure 1). The choice of using peak width at 4.4% peak height to directly determine 5σPeak values, while somewhat arbitrary, was selected due to it being the peak width value at the lowest percent of peak height that is reported in most common chromatography data systems such as Waters Empower 3 and Agilent ChemStation. For typical biotherapeutic protein analyses, the HMW and LMW peak heights are at 0.5% of the main peak height or lower. As stated previously, the assumption in using the direct peak width measurement approach is that the peak approximates a normal distribution. However, as can be seen in the dispersion profiles shown in Figure 2, the extra-column dispersion peaks are asymmetrical with a noticeable tailing or skewed profile, and making a peak width measurement closer to the baseline will potentially account for more of the influence of peak tailing.

For this same data set, the determination of σec was also calculated as the square root of the second-moment (M2) or variance of the peak. This approach is more appropriate for the determination of variance for a skewed distribution and is determined by the calculation: 


(Equation 5)
Figure 2. Measurements of 5-sigma extra-column dispersion volumes (5σec ) for this study based on peak width at 4.4% peak height and the expected range of values for Waters LC systems. Experiments were carried out as described in the caption of Figure 1. Sample loops were connected pre-column to generate the larger dispersion volumes.

Where M0 and M1 are zero and first moments of the peak, M0 is calculated as the peak area and M1 is the time at the geometric center or mean of the peak. For a normally distributed Gaussian peak, this is equivalent to retention time of the peak, but, for a tailing peak it will be located at a slightly later time. In this case, M1 is then calculated as:

(Equation 6)

The most important relationship to note in the calculation of M2 (Equation 5) is that the time difference between a point on the elution profile and M1 is a square function. Hence, the calculation of the variance is more heavily weighted by values further from the mean even though their intensities are relatively low. Because of this dependency, the assignment of the end of the peak can significantly impact the determination of M2. In order to provide a consistent, baseline end point, the M2 values were calculated within the Empower 3 Software using Waters ApexTrack integration function with a percent touchdown value of 0.05% and a 5-point moving average smoothing function. The values of M2 were then converted to σec by multiplying the flow rate by the square root of M2.

A correlation plot of the 5σec values determined by the peak width and second moment calculations is presented in Figure 3. We can see that at low levels of extra-column dispersion, the peak width method under estimates σec while the values at high levels of dispersion are more similar. The chromatographic inset shows an example of the system dispersion measurements. While this profile shows that more of the lower portion of the peak is incorporated into the M2 determination of σec versus the direct peak width method, it is also evident that the M2 method baseline does not incorporate all of the peak tail.

Figure 3. Shown is the correlation between 5σec volumes based on the second moment peak variance and on the peak width at 4.4% peak height. The chromatogram for the 22.0 μL dispersion (width at 4.4% peak height) is shown in the inset. The green double arrows indicate where direct 4-sigma (13.4%) and 5-sigma (4.4%) peak volumes are determined. The blue dashed line indicates the location of the 0.05% touchdown (TD) baseline as determined by Empower 3. The red dashed line indicates the parallel zero baseline.

As a result, while this M2 method provides a value for σec that is perhaps closer to the true value, it is certainly an underestimation as well.7 Although there is a noted bias between the peak width method and the M2 method, there is a reasonable correlation between the two methods (R2 = 0.96). It was also noted that the determinations of σec using the M2 method are significantly more variable than those obtained for the peak width method with a six times higher relative standard deviation on average. Therefore, we have opted to use the 4.4% peak width method for this study as it is adequate for the relative comparison of LC performance, and is more reproducible despite significantly underestimating the true system dispersion.8 In addition, the direct 4.4% peak width method has the advantage of being more easily implemented in analytical laboratories using different chromatography data systems and where LC system performances can significantly vary.

It is important to recognize that we have arbitrarily defined the measurement of system dispersion to include a specific analyte and its concentration, as well as, a mobile phase composition and programmed running conditions. When comparing the dispersions of LC systems across an organization, these variables need to be consistent to provide meaningful results. However, in practice, using the SEC method mobile phase and a protein sample could be more convenient. To make this comparison, we measured a range of system dispersions using the caffeine standard and the Intact mAb Mass Check Standard reconstituted at a concentration of 2 mg/mL in the SEC mobile phase. Similarly, in order to minimize the refractive index difference between the sample buffer and the mobile phase, a reference material could be buffer exchanged into mobile phase. Or, if the concentration is high enough, and the buffer does not have any interfering chromophores, it may be possible to dilute the protein reference material directly into the mobile phase.

A comparison of the dispersion profiles for caffeine and IgG is shown in Figure 4. The peaks for the IgG tail were observed more significantly than those for caffeine, and the measured 5σec volumes were greater. A correlation plot for the two methods (Figure 4) reveals that there is a reasonable correlation between the two methods with the values determined using IgG measuring approximately 33% higher based on the slope of the curve. This result is consistent with Equations 3 and 4, where dispersion has inverse relationships with the diffusion coefficient of the analyte. While we observe a significant bias between the two methods, these results demonstrate that using an appropriate protein sample can provide a useful and easy-to-implement relative evaluation of LC system dispersion.

Figure 4. Shown is the comparison of system dispersion measurements at 5σ (width at 4.4% peak height) measured with a caffeine and an IgG standard. Experiments were carried out as described in the Figure 1 caption. Sample loops were connected pre-column to generate the larger dispersion volumes.

Impact of System Dispersion on SEC Separation Efficiency

It can be assumed that in the absence of extra-column dispersion, if two columns of the same length, but different internal diameters, are packed with the same particles and with the same plate count, then those columns will provide the same resolution when the same linear velocity, and a proportional sample load relative to the column volume, are maintained. Or more simply stated, resolution is independent of column I.D. Under these constraints, the peak widths observed for these two different size columns will be equivalent in the time domain, but the volume of a peak for the larger I.D. column will be proportionally larger due to its higher flow rate. The practical implications of these relationships are that as SEC peak volumes become smaller due to the use of smaller internal diameter columns, extra-column dispersion can have a greater deleterious impact on the net chromatographic result.

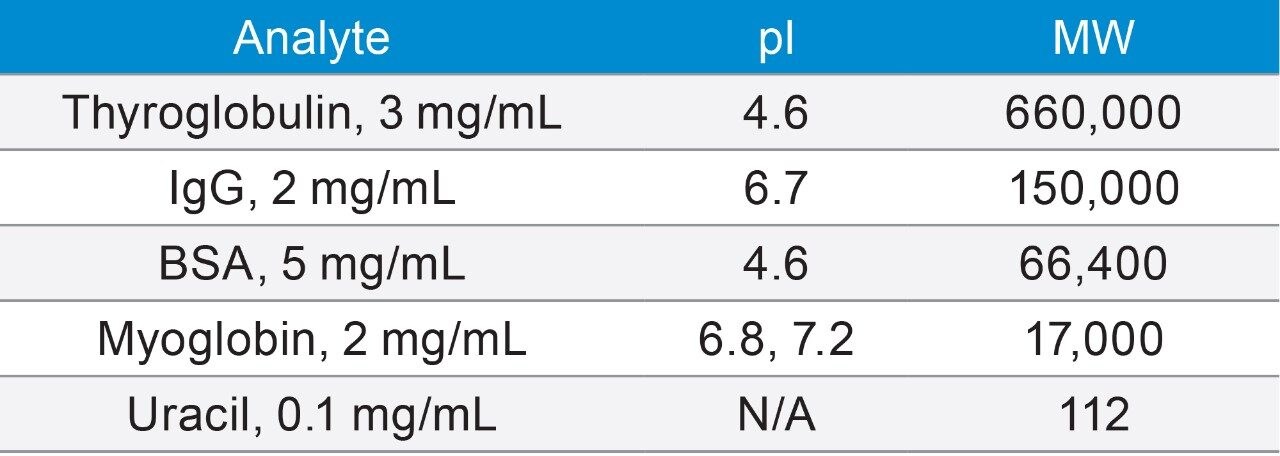
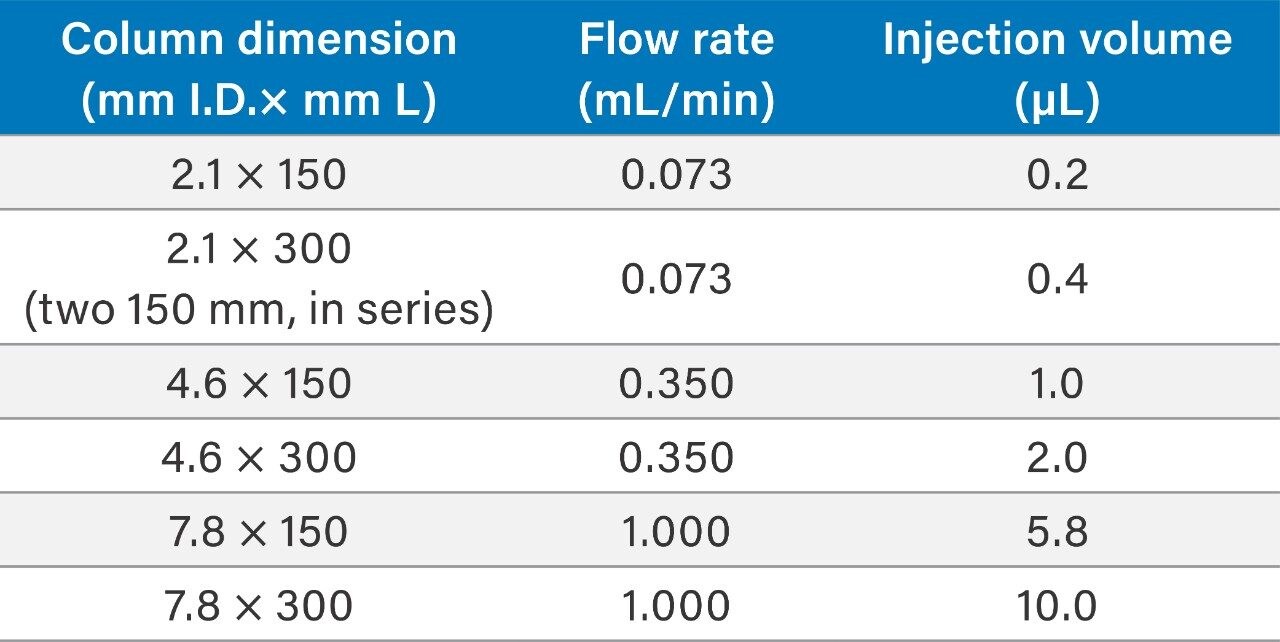
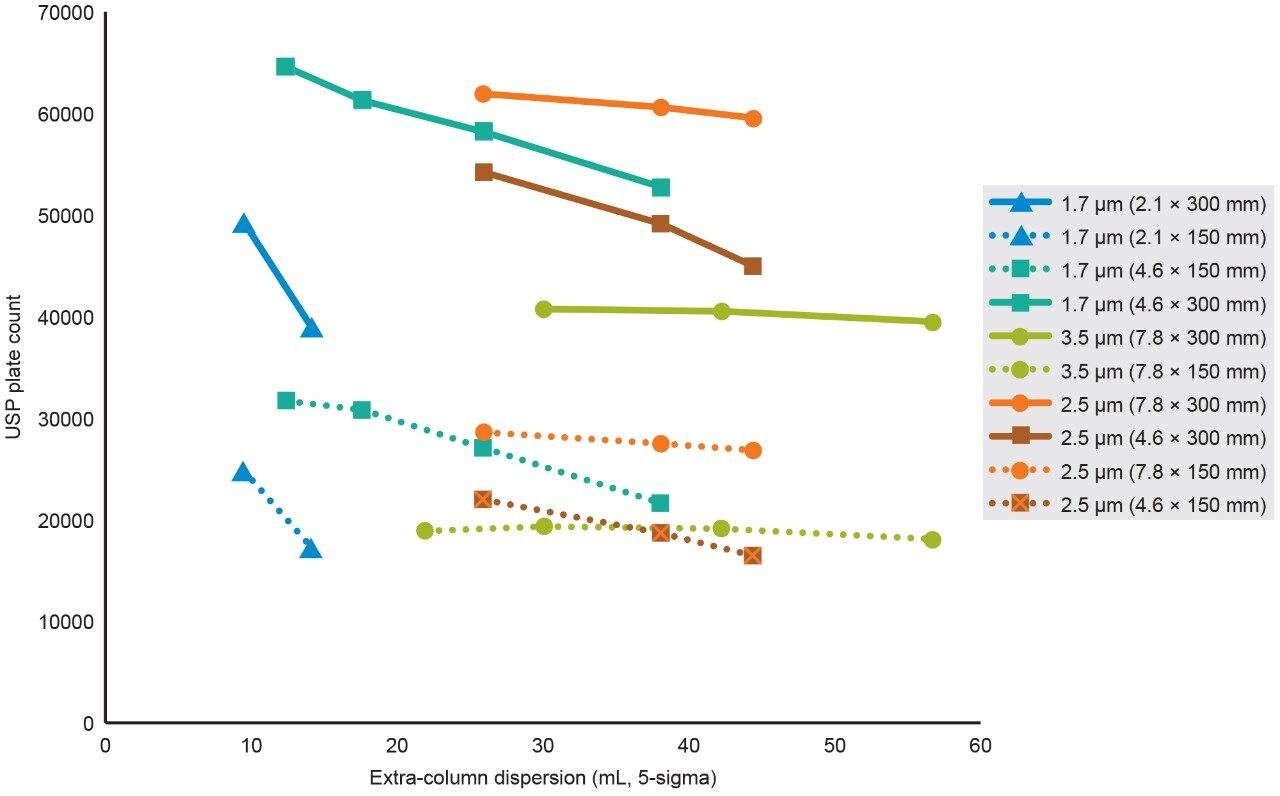
To assess the impact that σec has on SEC separations as a function of particle size, column I.D., and column length, the SEC MW protein standard mix was injected on 2.1 mm and 4.6 mm I.D. columns packed with 1.7 μm particles, 4.6 mm and 7.8 mm I.D. columns were packed with 2.5 μm particles, and 7.8 mm I.D. columns were packed with 3.5 μm particles. Column lengths of 150 and 300 mm were tested, and, in all cases, the average pore diameter of the particles was 200 Å. The 300 mm bed length, 2.1 mm I.D. column was simulated by running two 2.1 × 150 mm length columns, in series. For these experiments, the linear velocities were held constant, therefore, for a given column length the analysis times are equivalent. In addition, sample loads were appropriately scaled based on column volume.

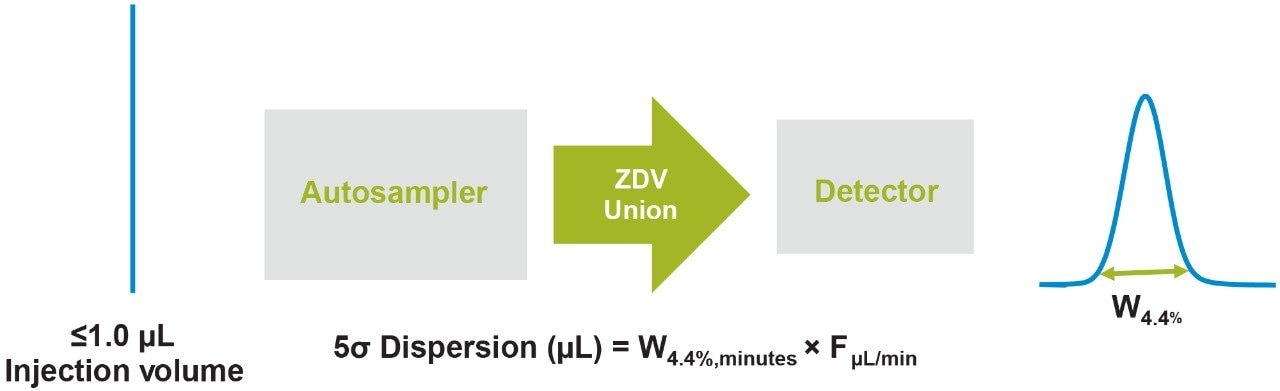
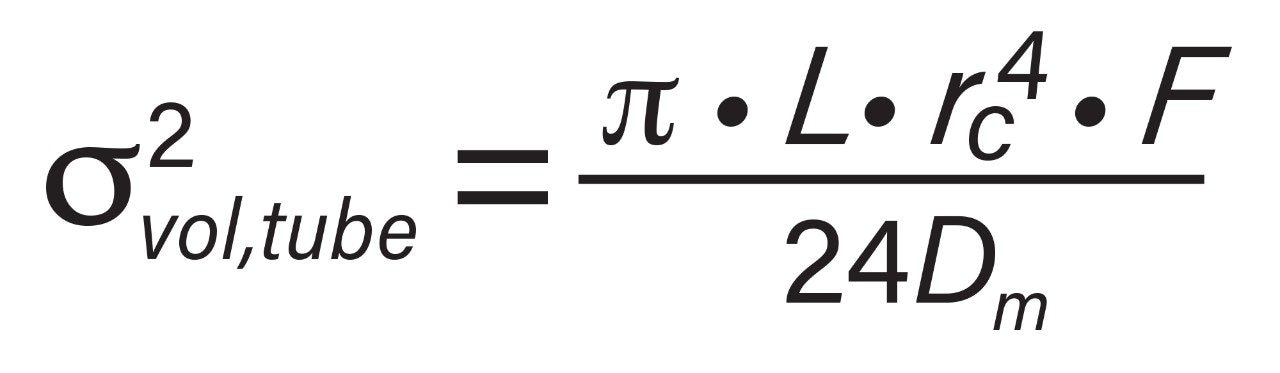
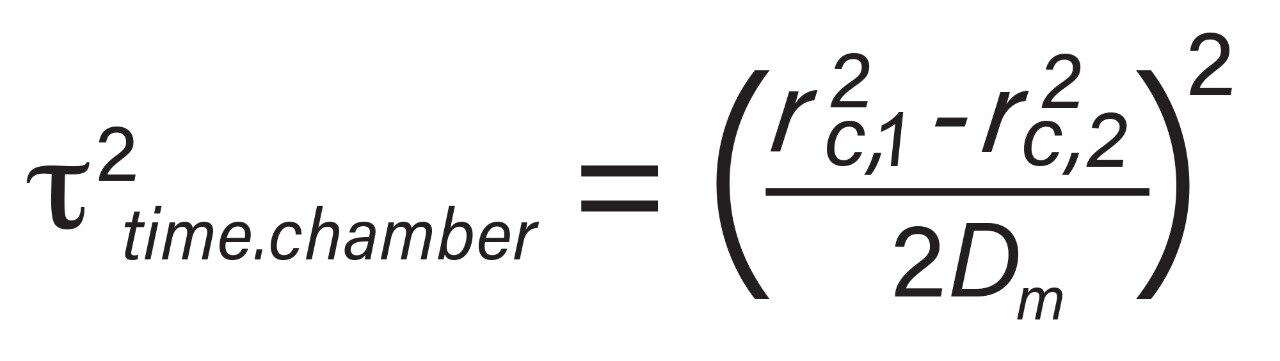
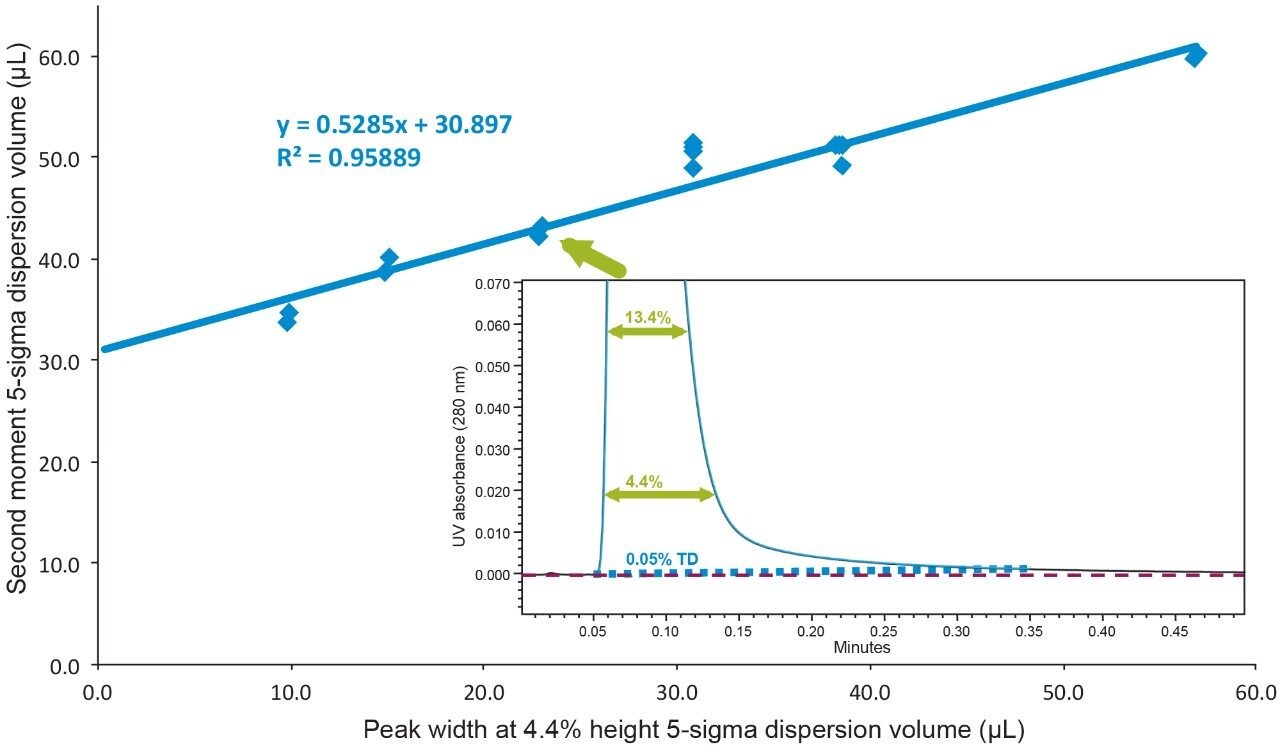
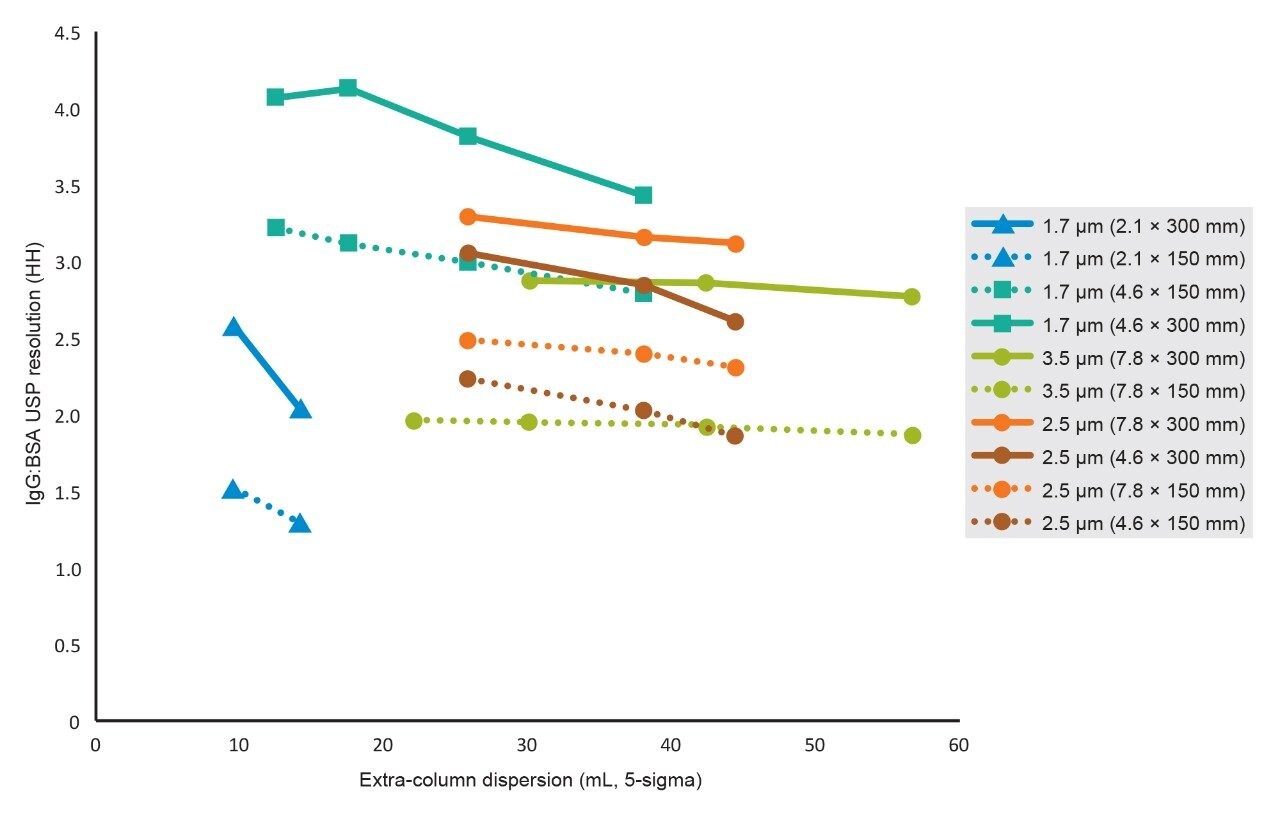
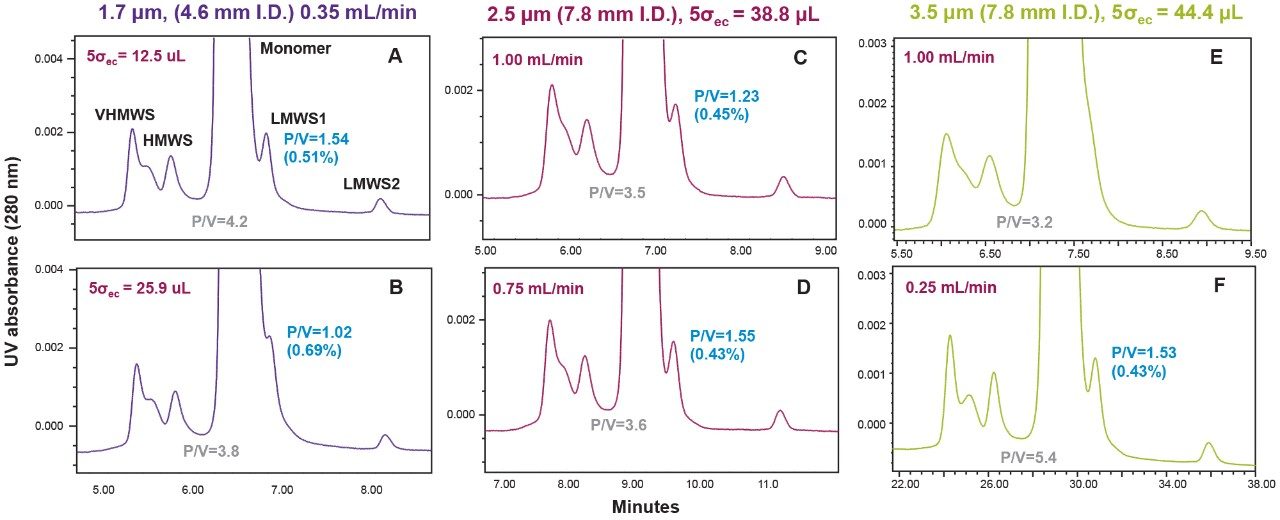
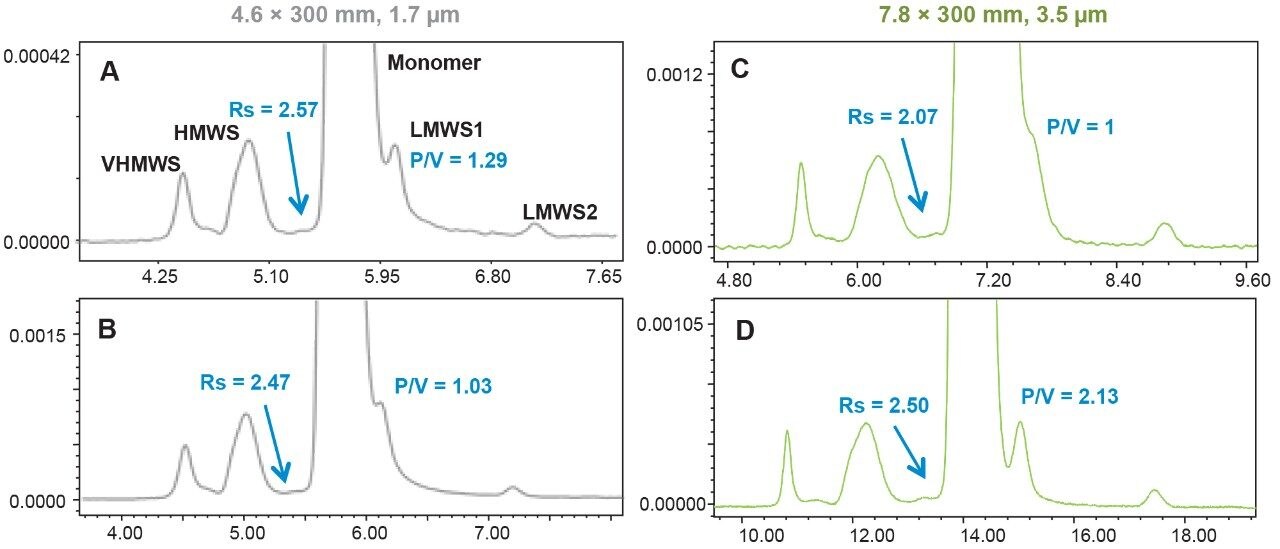
Representative chromatographic profiles for the 2.1 mm and 4.6 mm I.D. columns packed with 1.7 μm particles obtained over a range of system dispersions, are presented in Figure 5. These chromatograms were selected as they provide the most visually discernable changes. Quantitative measures of the USP plate counts (based on uracil) and the resolution between the two largest baseline resolved proteins, IgG and BSA, are presented in Figures 6 and 7, respectively. Additionally, to get a sense of the peak volumes produced by these SEC columns, we determined the estimated 5σec peak volumes for the proteins IgG, BSA, and myoglobin based on the direct measurement of peak width at 4.4% peak height (Figure 8). To obtain a better estimate of the 5σcolumn volumes, we have subtracted the contributed 5σec from the measured protein peak widths (5σpeak) using the relationship shown in Equation 1.

Figure 5. Impact of extra-column dispersion volume (5σec) on the separation of MW standards with 1.7 μm particle size SEC with column internal diameters of 2.1 mm and 4.6 mm and lengths of 150 mm and 300 mm. Sample injection volumes and flow rates were proportional to column internal diameter. Peak identifications (shown in top left chromatogram) are: (A1) thyroglobulin dimer (1.32 MDa), (A2) thyroglobulin monomer (660 KDa), (B) IgG (150 KDa), (C) BSA (66 KDa), (D) myoglobin (17 KDa), and (E) uracil (112 Da).

It is visually obvious that the peak widths and resolutions obtained for the 2.1 × 150 mm and 2.1 × 300 mm columns are significantly degraded compared to those obtained on 4.6 mm I.D. columns of equivalent lengths and packed 1.7 μm particles (Figure 5). Indeed, the uracil derived plate counts (Figure 6) measured for even the longer 300 mm length, 2.1 mm I.D. columns (5σec = 9.5 μL) were 22% lower than those of the 4.6 mm I.D. column (5σec = 12.5 μL) and the resolution between IgG and BSA was 36% lower for the 2.1 mm I.D. column. These decreases in efficiency and resolution are a direct result of the 5σpeak peak volumes for the 2.1 mm I.D. columns being only approximately 2 to 3 times greater than the 5σec dispersion volume, while the 5σpeak peak volumes for the 4.6 mm I.D. columns are 5 to 9 times greater than the 5σec dispersion volume at which they were tested. Since the peak and dispersion volumes are squared before they are added together (Equation 2) this difference is even more significant.


Figure 6. Shown are the measured USP plate counts determined based on the uracil peak plotted versus extra-column dispersion (σec). Columns with 1.7 μm particle size are in blue hues, columns with 2.5 μm particle size are in orange or brown, and columns with 3.5 μm particle size are in green. Triangles, squares, and circles indicate 2.1, 4.6, and 7.8 mm I.D. columns, respectively. Sample injection volumes and flow rates were proportional to column internal diameter.

The impact on system dispersion can also still be seen for larger sized columns, when comparing the results for the 4.6 mm and 7.8 mm I.D. columns packed with 2.5 μm particles. At a 5σec of 25.9 μL, the plate counts were 23% and 12% lower, and the resolutions between IgG and BSA were measured to be 10% and 7% lower for the 4.6 mm I.D. columns at lengths of 150 mm and 300 mm, respectively. However, as 5σec increases to 44.4 μL, which is a good performance for typical HPLC systems, we observe 38% and 24% decreases in the plate counts, and concomitant resolution decreases of 20% and 16%.

As an aside, it should be noted that the observed decreases in IgG and BSA resolution for the 2.1 mm I.D. (1.7 μm) column far exceeds the 12% decrease in peak resolution we would estimate based on the reduction in plate count (N).

Figure 7. Shown are the measured USP resolution values between the primary IgG and BSA peaks. Columns with 1.7μm particle size are in blue hues, columns with 2.5 μm particle size are in orange or brown, and columns with 3.5 μm particle size are in green. Triangles, squares, and circles indicate 2.1, 4.6, and 7.8 mm I.D. columns, respectively. Sample injection volumes and flow rates were proportional to column internal diameter.
Figure 8. Shown are the estimated 5σec peak volumes (based on peak width at 4.4% height) for the IgG, BSA, and myoglobin peaks in the column configurations evaluated. Peak volumes were corrected for 5-sigma system dispersion volume based on the relationship shown in the inserted equation (Equation 2 in the text). The expected range of values for Waters LC systems are also provided for comparison.

In comparison of the 4.6 mm I.D. (2.5 μm) and 7.8 mm I.D. (2.5 μm) columns, the plate count and resolution changes are more consistent with Equation 7. This discrepancy is a result of the extra-column dispersion volumes being larger for the protein standards (Equations 3 and 4) versus the uracil standard. In addition, the column derived 5σpeak volumes for the protein standards are decreased for the 1.7 μm columns versus columns packed with 2.5 μm particles, as described by the Van Deemter equation.

(Equation 7)

Rs ∝ √N

Where the theoretical plate height (H), which is inversely proportional to column efficiency (N), relates to mobile phase velocity (u), particle diameter (dp), and the diffusion coefficient of the analyte (Dm). The “a” term reflects eddy diffusion and the “c” term represents mass transfer into the pores of the particle. For the SEC separation of proteins, the “b” term, or longitudinal diffusion term, can be ignored due to the small value of Dm. As a result, because dp is squared in the “c” term of the Van Deemter equation, the contribution that decreased values of Dm have toward increased plate heights is reduced for the 1.7 μm column versus the 2.5 μm column.

(Equation 8)

Practically, these results demonstrate that if two columns are packed with the same size particles, the larger I.D. column will result in a method with significantly improved efficiency (i.e., component resolution) when using LC systems where extra-column dispersion volume is substantial relative to analyte peak volumes. Additionally, the relative impact of extra-column dispersion will be greater for columns with shorter lengths and smaller particle sizes. The larger I.D. column will also provide greater analytical consistency and robustness as a method is transferred to various LC systems, and the method will also provide more sensitivity for low abundance analytes when the injection volumes are adjusted proportionally to column volume. The only advantages to be gained by using the smaller I.D. column packed with the same size particles will be the ability to use smaller volumes of sample and less total mobile phase; however, system dispersion may need to be more carefully controlled in order to not compromise separation quality.

Selecting a column and particle size for an SEC method

The major considerations in selecting a column are interdependent, and also include the sample throughput needs and the performance capabilities of the LC systems being used for the method. Finally, both sample volume limitations and mobile phase use may also be considered. Understanding the extra-column dispersion and pressure limits of the LC systems to be employed, as has been demonstrated, is of paramount importance as these limits can restrict your choice of column geometries; but, more significantly, may limit the sample-throughput of your method by precluding the use of sub-2-μm columns which are only currently available with an I.D. of 4.6 mm or smaller. It should be noted that the impact of extra-column dispersion on the separation of a low-abundance, partially-resolved, antibody protein fragment (Figures 9A and 9B [LMWS1]) is greatly magnified relative to the changes observed for aggregate (HMW) protein peaks due to the tailing nature of system dispersion. The impact of extra-column dispersion on the SEC separation of monoclonal IgG antibodies is more thoroughly evaluated in a companion application note (p/n: 720006336EN).

Figure 9. Zoomed view chromatograms demonstrating the impact of extra-column dispersion on the SEC separation of aggregates (VHMWS and HMWS, ≥300 KDa), and the mAb fragments LMWS1 (≥100 KDa) and LMWS2 (≥50 KDa). For rituximab (≥150 KDa), Frames A and B are the results obtained using a 4.6 × 300 mm (1.7 μm) column at a fixed flow rate while altering extra-column dispersion. Frames C and D, and frames E and F are the results obtained using a 7.8 × 300 mm (2.5 μm or 3.5 μm) column at fixed extra-column dispersion while altering flow rate. The separation conditions are as described in the text.

When used with low-dispersion UPLC systems (5σec ≤ 25 μL) 4.6 mm I.D. columns packed with 1.7 μm particles will always provide greater resolution than the same column size that is packed with 2.5 μm particles. However, in comparison to a larger 7.8 mm I.D. column of equivalent length and packed with 2.5 μm or larger particles, the performance advantage of the 4.6 mm I.D. (1.7 μm) columns may substantially decrease as system dispersion increases. This often can be the case in protein fragment separations, where it may be found that the use of a 7.8 mm I.D. (2.5 μm) column may provide a comparable or improved separation to that observed with a 4.6 mm I.D. (1.7 μm) column with little or no compromise in sample throughput (Figures 9A through 9D), depending on system dispersion levels. The larger column I.D. also provides the added benefits of a method that is more change tolerant in system dispersion as demonstrated by the better resolution of the LMWS1 peak observed using the 2.5 μm column at a 5σec of 38.8 μL versus the resolution observed for the 1.7 μm column at a 5σec of 25.9 μL (Figures 9B and 9C). In addition, the larger particle sized column operates at a lower pressure, and is more economical.

For high-dispersion LC systems, which for these studies could be defined as a 5σec value of approximately 40 μL or more, columns with internal diameters of 7.8 mm are recommended. In all cases, the smaller 2.5 μm particle size will provide greater resolving power than the larger 3.5 μm particle size (Figures 9C and 9E). The advantage of the 3.5 μm particle sized columns, however, is lower cost and 50% lower operating pressures since column pressure is proportional to the square of particle diameter.

In the event that the larger particle size column does not provide the needed resolution, it may be necessary to either reduce flow rate as shown for the 2.5 μm and 3.5 μm columns in Figure 9. Another option is to increase column length. As demonstrated in Figure 10, by operating two 30 cm length, 3.5 μm particle sized columns in series at the same flow rate used for a single column, greater resolution of both the aggregate (fragment [LMW]) is achieved while analysis time is only doubled versus the 1.7 μm particle size column.

The final consideration to be discussed is when an SEC method is required for use with minimal sample volumes or reduced mobile phase consumption. This is most simply achieved by reducing the internal diameter of the column being used since injection volume and flow rate are proportional to the square of the column I.D. However, as we have seen, the impact of extracolumn dispersion must be dutifully considered. Alternatively, decreasing flow rate and using a shorter column length will also reduce sample and mobile phase volumes. Decreasing flow rate not only provides greater efficiency from an SEC column, but it also decreases the extra-column dispersion of the separation. In taking this approach, either analysis time or resolution must be partially compromised.

Figure 10. Shown are comparisons of 2.0 mg/mL trastuzumab (Herceptin) run with the ACQUITY UPLC BEH, 200 Å (1.7 μm, 4.6 × 300 mm) Column on an ACQUITY UPLC H-Class Bio System (Frame A, 5σec = 20 μL) and an ACQUITY Arc Bio System (Frame B, 5σec = 34 μL). The results for a single and tandem XBridge BEH 200 Å (3.5 μm, 7.8 × 300 mm) Columns on the ACQUITY Arc Bio System (Frames C and D) are also compared. The mobile phase was 25 mM phosphate and 400 mM NaCl at pH 7.2. Injections volumes were 5 μL for the 4.6 × 300 mm column, 15 μL for the 7.8 × 300 mm column, and 21.2 μL for the two 7.8 × 300 mm columns in series. The 4.6 mm I.D. column used a flow rate of 0.4 mL/min while the XBridge BEH 200 Å Column used a flow rate of 1.0 mL/min. Peak identifications are provided in Figure 9.

Conclusion

Selecting the most appropriate SEC particle size and hardware configuration for a column to be used in a protein SEC method will be influenced by the requirements of the separation and the performance capabilities of the LC systems to be used. In summary, these relationships, as illustrated in this application note, include:

  • True SEC column efficiency (plate count) is independent of column I.D. when sample volume and mobile phase flow rate are scaled to the square of the column I.D.
  • With particle size, column length, and packing efficiency being comparable, and flow rate and injection volume being scaled, a larger I.D. SEC column will provide better resolution than a smaller I.D. column due to the diminished impact of extra-column dispersion on the increased peak volumes generated by the larger I.D. column.

The separation efficiencies observed for 4.6 × 300 mm and shorter SEC columns are significantly more dependent on extra-column dispersion levels than 7.8 mm I.D. columns of equivalent length. As a result, while it is good practice to always include the determination of extra-column dispersion in LC system suitability testing, it is strongly encouraged for LC systems used to run SEC methods that employ 4.6 mm and smaller I.D. columns.

  • SEC column efficiency is inversely proportional to particle size.
  • SEC column efficiency is proportional to column length.
  • SEC column efficiency is improved at lower flow rates.
  • Decreased sample injection volume and mobile phase use can be achieved by using shorter length or narrower I.D. columns at lower flow rates.
    • Shorter columns will compromise either resolution or sample throughput.
    • Smaller I.D. columns may significantly compromise resolution if LC system dispersion is not considered and minimized.
    • Selecting a smaller I.D. column that also incorporates smaller sized particles will maximize resolution and sample throughput, however, operating pressure will also increase.

References

  1. Hong, P.; Koza, S.; Bouvier, E.S. Size-exclusion chromatography for the analysis of protein biotherapeutics and their aggregates. J. Liq. Chromatogr. Relat. Technol. 2012, 35, 2923–50.
  2. Goyon, A.; Guillarme, D.; Fekete, S. The importance of system band broadening in modern size exclusion chromatography. J. Pharm. Biomed. Anal. 2017, 35, 50–60.
  3. Fountain, K.J.; Neue, U.D.; Grumbach, E.S.; Diehl, D.M. Effects of extra-column band spreading, liquid chromatography system operating pressure, and column temperature on the performance of sub-2- micron porous particles. J. Chromatogr., A. 2009, 1216, 5979–88.
  4. Grinias, J.P.; Bunner, B.; Gilar, M.; Jorgenson, J.W. Measurement and modeling of extra-column effects due to injection and connections in capillary liquid chromatography. J. Chromatogr. 2015, 2, 669–90.
  5. Vanderheyden, Y.; Vanderlinden, K.; Broeckhoven, K.; Desmet, G. Problems involving the determination of the column-only band broadening in columns producing narrow and tailed peaks. J. Chromatogr., A. 2016, 1440, 74–84.
  6. Vanderheyden, Y.; Broeckhoven, K.; Desmet, G. Peak deconvolution to correctly assess the band broadening of chromatographic columns. J. Chromatogr., A. 2016, 1465, 126–42.
  7. Vanderheyden, Y.; Broeckhoven, K.; Desmet, G. Comparison and optimization of different peak integration methods to determine the variance of unretained and extra-column peaks. J. Chromatogr., A. 2014, 1364, 140–50.
  8. Spaggiari, D.; Fekete, S.; Eugster, P.J.; Veuthey, J.L.; Geiser, L.; Rudaz, S.; et al. Contribution of various types of liquid chromatography-mass spectrometry instruments to band broadening in fast analysis. J. Chromatogr., A. 2013, 1310, 45–55.

Acknowledgements:

The authors would like to thank Paula Hong for supplying Waters LC system dispersion data.

720006337, June 2019

Back To Top Back To Top