This application note demonstrates the analysis of terpenes in one cultivar of hemp and one cannabis cultivar using an electron ionization (EI) GC-MS/MS, a system also capable of analyzing for trace level pesticide residues.
Terpenes are produced by a wide variety of plants serving such purposes as attracting pollinators and deterring herbivores. These functions are critical to the survival of the plant; thus, terpene production is a primary metabolic process. The specific terpenoids characteristic of a certain plant relate to its genetic lineage and its interaction across time with other organisms and the environment.1,2
In hemp and cannabis, terpenes are among the more abundant compounds produced and make up the main constituents of the aroma profile of the plant material and extracts.3 They also have been shown to contribute to physiological responses associated with the use of hemp-based consumer products.4 The aroma profile is directly linked with consumer preference and satisfaction, and can play a role in both perceived and actual physiological responses. The relative and absolute abundance of the specific terpenes present in the raw plant material, and in hemp-derived and cannabis-derived products, is important in quality control of incoming raw ingredients as well as in finished products across their intended shelf life.
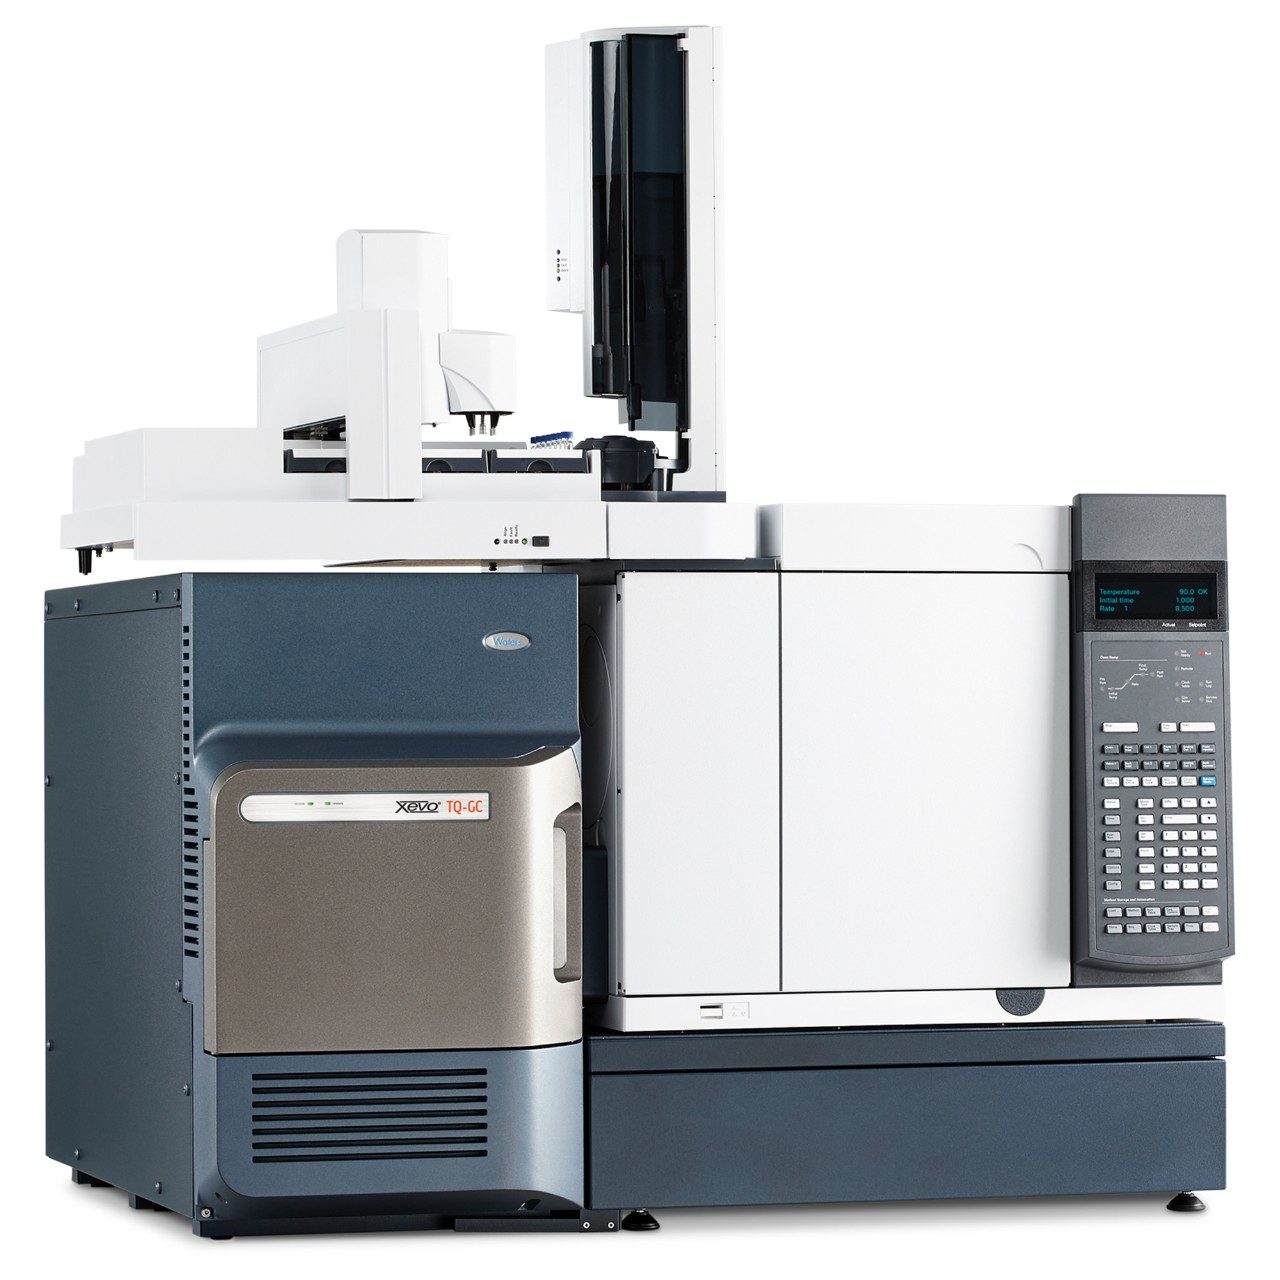
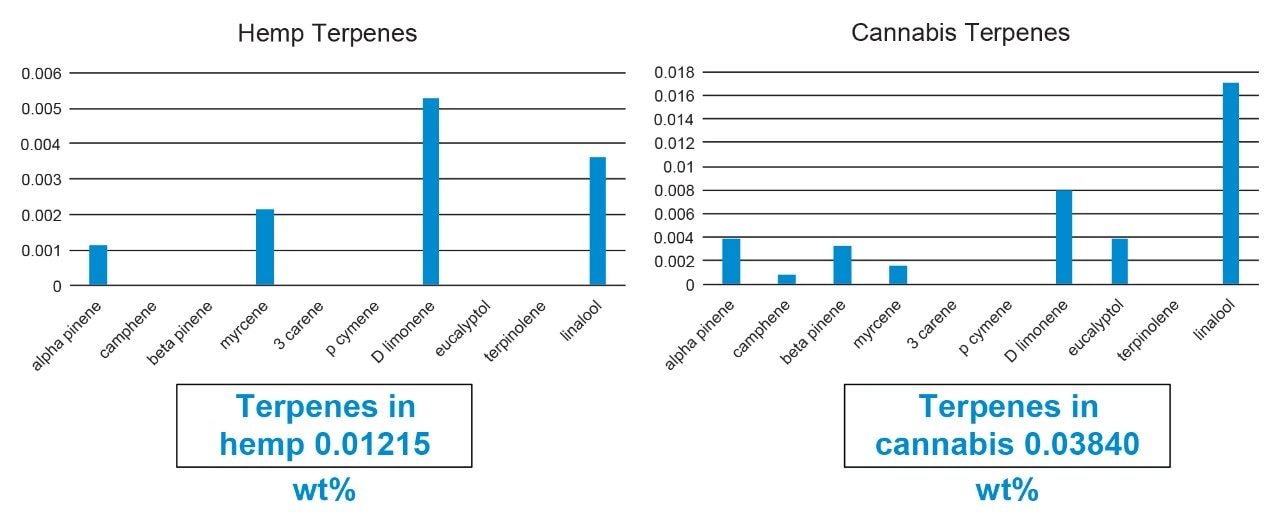
In this application note, the analysis of terpenes in one cultivar of hemp and one cannabis cultivar is demonstrated using an electron ionization (EI) GC-MS/MS, a system also capable of analyzing for trace level pesticide residues.5 The trace analyses of residual pesticides is performed in order to ensure the safety of the sample for direct use or use as an ingredient. The analysis of terpenes, on the other hand, is primarily aimed at assessing the quality of a sample, as they are among the abundant, desirable, and commercially important products of these plants. The ability to perform both tests on a single instrument platform is beneficial in labs where space limits the number of dedicated systems that can be accommodated. It also reduces training needs for operators and improves utilization of the GC-MS/MS system.
A Waters Xevo TQ-GC Tandem Quadrupole Mass Spectrometer (MS/MS) coupled with an Agilent 7890B gas chromatograph (GC) and 7693A autosampler was used to carry out the analysis of 10 terpenes (Figure 1). Appendix A includes the analyte list, MRM transitions, and collision energies. MassLynx v4.2 Software was used for acquisition with the TargetLynx XS application manager for processing. The NIST 2017 Mass Spectral Library was also used for processing of full scan EI data.
MS system: |
Xevo TQ-GC |
Ionization: |
EI+ at 70 eV and 200 μA Emission Current |
Source voltage: |
1 V |
Repeller: |
45 V |
Extraction lens: |
50 V |
Focus 1 lens: |
23 V |
Focus 2 lens: |
200 V |
Transfer line temp.: |
275 °C |
Source temp.: |
175 °C |
Solvent delay: |
2.0 min |
GC system: |
Agilent 7890B with 7693A autosampler |
Column: |
Restek Rxi-5MS 20 m × 0.180 mm I.D. × 0.18 μm film |
Carrier gas: |
Helium at 0.4 mL/min |
Injection: |
1 μL split 50:1 at 275 °C using 4 mm I.D. straight inlet liner with wool |
Temp. program: |
40 °C for 0.50 min then ramped at 20 °C/min to 140 °C, then 40 °C/min to 320 °C and hold 1.00 min for a total run time of 11.0 min |
100 mg of pre-ground plant material was weighed into a 20 mL scintillation vial. Five milliliters of ethyl acetate containing 50 ng/μL n-tridecane as an internal standard was added to the vial. After sonication for 15 minutes, approximately 4 mL of the resultant extract was transferred to a 4 mL amber vial. Samples were centrifuged and a portion was transferred to 2 mL autosampler vials. This sample preparation procedure was adapted from recent work that included investigation of various extraction solvents and included validation of the method using GC-MS.6
Unlike residual pesticide analysis which focuses on sensitivity, the analysis of terpenes is more heavily reliant on efficient chromatographic separation in order to confidently distinguish between the near eluting analytes with similar structures. Therefore, carrier gas linear velocity was optimized prior to establishing the temperature program. Optimized linear velocity ensures that the column is operating at its highest efficiency. The optimum linear velocity range is 27–32 cm/s for the column in this study.7 At 40 °C, the linear velocity was 29 cm/s as reported on the display of the GC. This value takes into consideration the vacuum from the mass spectrometer drawing on the outlet end of the GC column. It is worth noting that the proper flow-rate to achieve the optimum linear velocity would be different for the same column if used with detectors that operate at atmospheric pressure such as atmospheric pressure gas chromatography (APGC) MS or flame ionization detection (FID). The ramp rate of the temperature program for the GC was subsequently adjusted for throughput and separation of critical pairs of analytes as well as other matrix related peaks.
During preliminary method development, it is important to consider co-extracted non-target matrix components along with the target analytes. Chromatographic and mass spectral performance characteristics can be adversely affected by co-extracted non-target compounds in the injection aliquot. Concurrent acquisition of full scan EI spectra while simultaneously evaluating MRM transitions in various matrices allows potential method challenges to be identified early and addressed more effectively than the use of MRM alone. This acquisition scheme is referred to as RADAR. Use of this approach during method development allowed the detection of cannabidiol in a hemp extract as shown in Figures 2 and 3. This finding and the use of the concurrent full scan acquisition throughout the entire run helped optimize the final bake out time for the GC method by ensuring it was long enough to elute high boiling co-extracted compounds without being held for an unnecessarily long time. The proper final hold time for the temperature program helps contribute to method robustness and eliminates carryover or ghost peaks. The use of a solvent extraction and liquid sample injection allow the monitoring for cannabidiol and THC using this method. This would not be possible using headspace for extraction and injection because THC and cannabidiol are not sufficiently volatile to give good recovery with a standard headspace-based approach.
Following method development using longer run times, samples were analyzed using an acquisition method that incorporated optimized MRM transitions for 10 terpenes (see Appendix A). The faster temperature program shortened the run time from 23 to 11 minutes while maintaining the chromatographic separation between critical pairs
Using the extraction method described above, six replicate extractions were prepared for each matrix. In addition, three replicates of each matrix were spiked with known concentrations of terpenes prior to extraction. Three of the non-spiked aliquots were divided and later spiked immediately prior to analysis. This was done to allow evaluation of the recovery of the terpenes extracted from the plant material.
Because many of the terpenes included in this study elute in a narrow time window, the ten MRM transitions used to detect them were grouped into a single window. Figure 4 shows the separation of critical pairs within this group of analytes. The MRM transitions in this example exhibit varying levels of specificity making the monitoring of multiple MRM transitions important for confident identification as well as to ensure accurate and precise quantitation. The monitoring of multiple MRM transitions across the entire elution range for the monoterpenes is also intended to make the method more easily adapted to the addition of new analytes in the same class. This may be required if the analysis is expanded to blended products that include ingredients derived from other plants in addition to hemp and cannabis
The example in Figure 4 helps to highlight the importance of optimized chromatographic resolution with the three analytes indicated all eluting within a six second time window. Width of the chromatographic peaks in this range is <3s and each has approximately 50 points defining it. The potential for misidentification is obvious in this region, and given this, the use of the ratio between MRM transitions to more confidently assign identity of each peak is important. Doing so means that the method can be both fast and adaptable to additional matrices in the future. The ratios between MRM transitions from a known concentration standard are used as a confirmatory element in GC-MS/MS analyses in much the same way some GC-MS methods use ratios between SIR, a.k.a. SIM, traces. Due to the higher specificity of MRM over SIR, however, the ratios between MRM transitions are much less subject to interference that can lead to misidentification or inaccurate quantitation.
Figure 5 is an example of the evaluation of ion ratios of two closely eluting analytes in the TargetLynx XS browser. Each analyte has very different ion ratios between the three MRM transitions. The acquisition of multiple MRM transitions common to many of the potential monoterpenes eluting within the same retention time range allows more definitive assignment of the correct identification and also facilitates the addition of compounds in this class to the analysis.
The quantitation results, including the evaluation of the ion ratio, for alpha pinene in TargetLynx XS are shown in Figure 6. Following that, Figure 7, is a summary of the specific terpenes found in each matrix and their relative amount expressed in weight percent of the raw plant material.
As shown, the cannabis cultivar used, Mendo Purps, had >3x the amount of terpenes than the hemp sample and a different range of analytes as well. The total weight percent (wt%) of the measured terpenes in the hemp sample was 0.0122% while the total in cannabis was 0.0384%.
Recoveries of the terpenes in the hemp matrix ranged from 84 to 105%, except for terpinolene which was somewhat lower at 64% recovery, shown in Figure 8. This is consistent with terpinolene recovery results reported elsewhere.6 In cannabis, matrix recoveries ranged from 99 to 126% except, again, for terpinolene which gave a somewhat low recovery at 73%.
The Xevo TQ-GC for the analysis of terpenes using EI GC-MS/MS was demonstrated using a simple microextraction of hemp and cannabis plant material. The benefits of MS and MS/MS acquisition modes for both method development and routine quantitation were shown to be applicable to multiple elements of terpenes analysis. This work, in combination with earlier studies, demonstrates the ability to use a single platform to perform multiple analyses required for the safety and quality testing of hemp.
720006781, February 2020