• Application Note

Analysis of Soft Drink Additives with No Interference from Aspartame Degradants Using Arc HPLC System with PDA Detection

Analysis of Soft Drink Additives with No Interference from Aspartame Degradants Using Arc HPLC System with PDA Detection

  • Jinchuan Yang
  • Paul D. Rainville
  • Waters Corporation

Abstract

Soft drinks may contain caffeine, benzoate, sorbate, acesulfame K, saccharin, and aspartame as additives. Conformance of the concentrations of these additives in soft drink products to target levels is an essential part of quality control in beverage manufacturing plants. One potential issue in the analysis of soft drinks is aspartame degradation, because its degradants may co-elute and interfere with the quantification of the target additives. This study describes the investigation of the degradation of aspartame and the optimization of the method to eliminate any chromatographic inference from its degradants. The injection linearity and accuracy of the Arc HPLC System was also investigated, and its performance was compared to volumetric pipettes. This optimized beverage analysis provides a fast, simple, and accurate HPLC method which can improve the overall productivity in a soft drink manufacturing environment. 

Benefits

  • Analysis of soft drink additives in a 12-minute isocratic run
  • No interference from aspartame degradation products 
  • Injecting smaller sample volumes for high additive content samples, minimizing manual sample dilution operation
  • Pre-formulated mobile phase, wash solvent, and standards for easy setup and preparation 
  • Ethanol-based mobile phase and wash solvent for low hazardous waste disposal costs 

Introduction

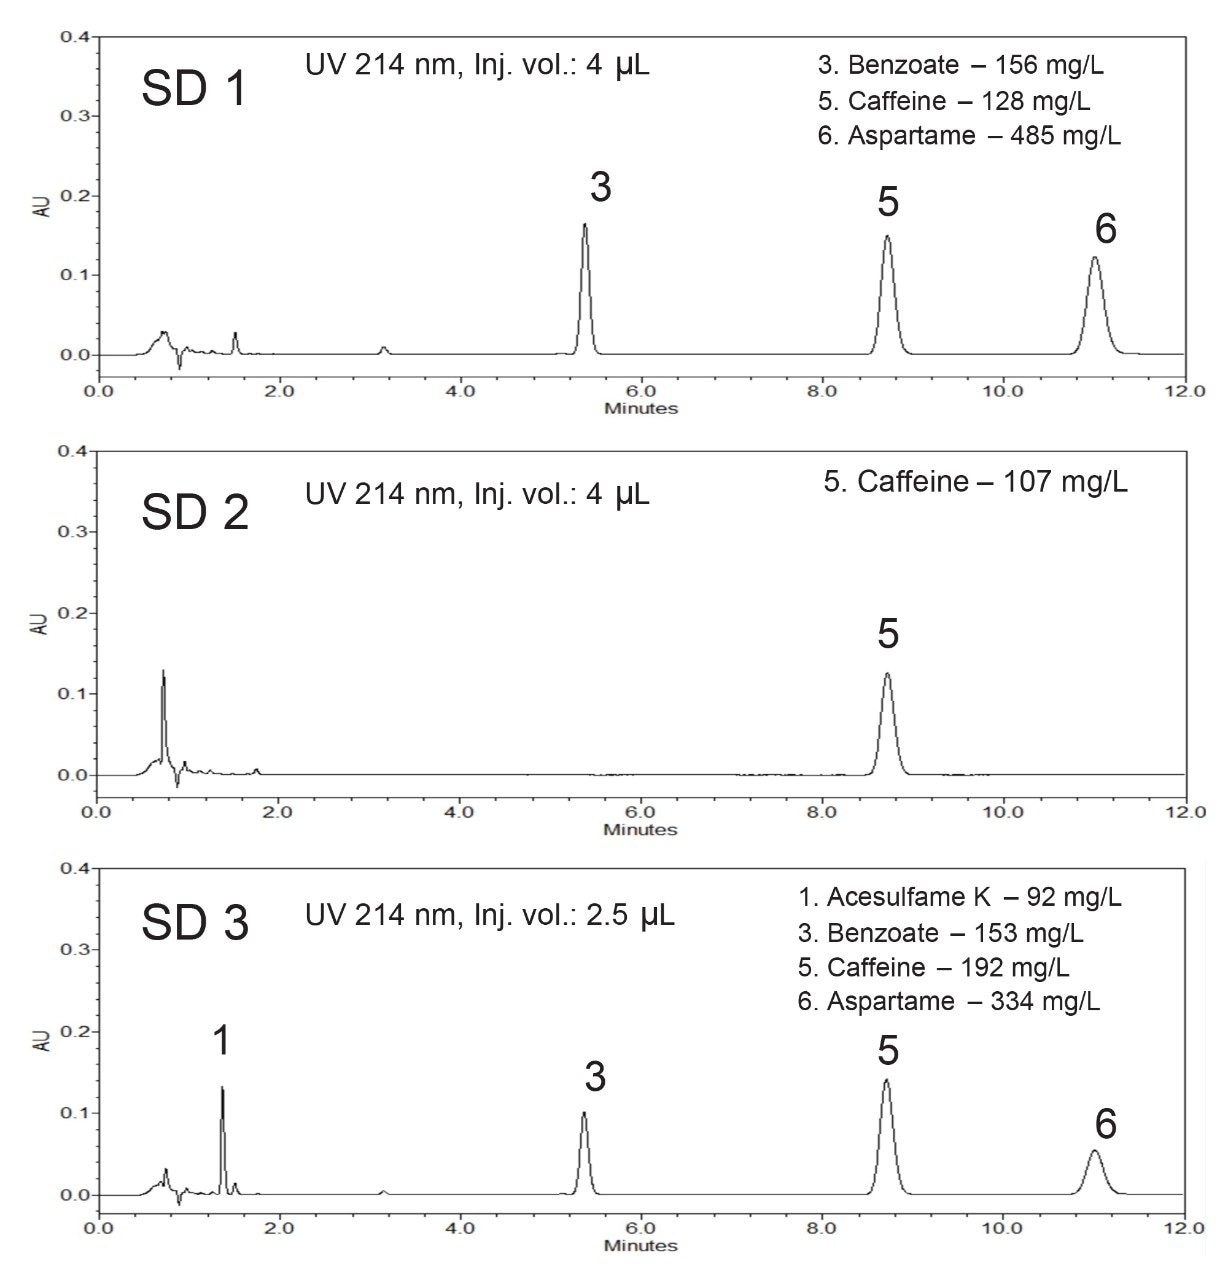
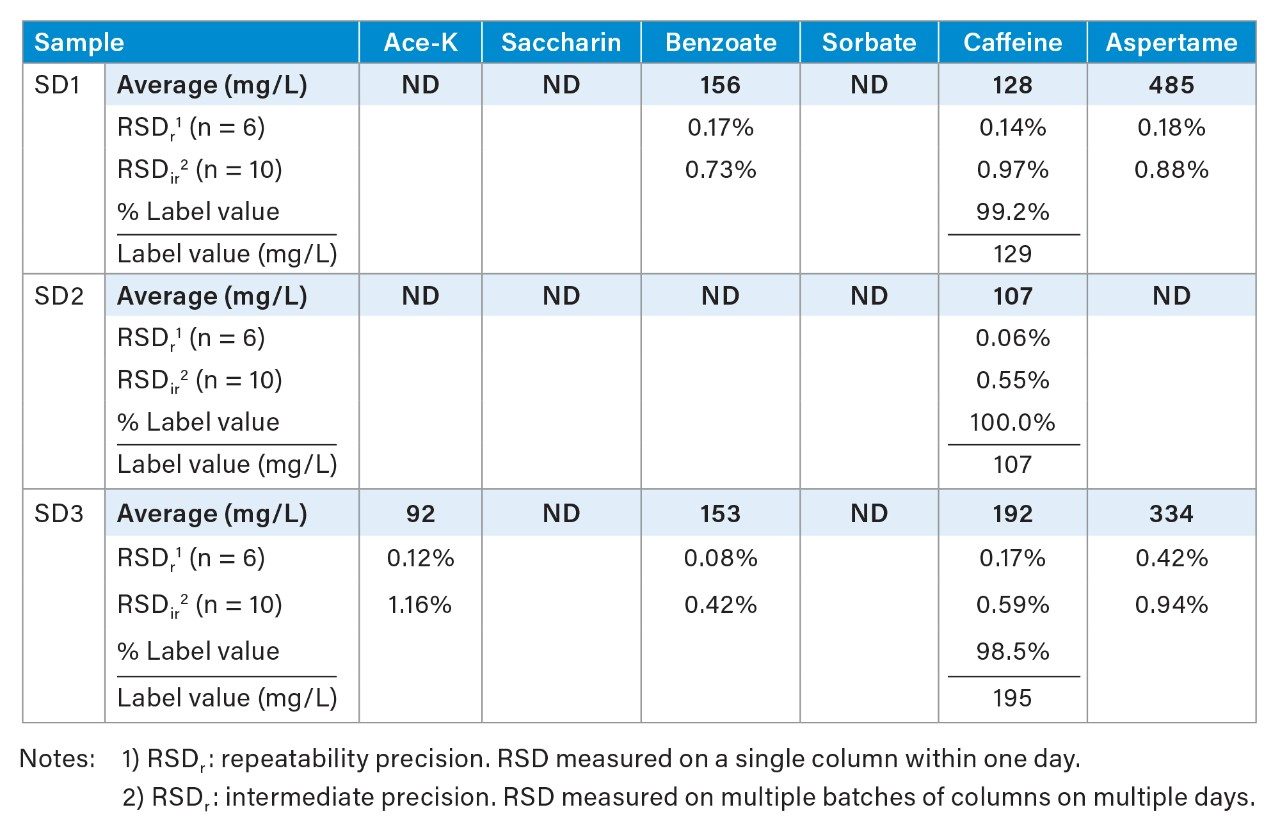
Soft drinks often contain caffeine as a stimulant or flavoring, sodium benzoate and potassium sorbate as preservatives, and artificial sweeteners such as acesulfame K (Ace-K), aspartame, and saccharin. For quality control (QC) purposes, the conformance of concentrations of these common six additives in final products to specified ranges is critical. One of the potential issues in soft drink analysis is the degradation of aspartame,1 because its degradants may co-elute and interfere with the additive quantification. In this work, we investigated the degradation of aspartame and optimized the existing beverage analysis method for use with the Arc HPLC System, resulting in a fast, simple and accurate analysis of beverage additives, in which the interference from the aspartame degradants to the quantification of additives was eliminated. This method uses the Waters Beverage Analysis Kit, which contains an environmental-friendly, pre-formulated mobile phase, wash solvent and standards. The Arc HPLC System has an improved injector design and a higher operating pressure limit than older HPLC technologies, which can improve the precision, accuracy, and speed of routine testing methods. The benefits of using the Arc HPLC System for beverage analysis are highlighted in this application note.   

Experimental

Standard Preparation

One bottle of Waters Beverage Analysis Standards (p/n 186006008) was poured into one bottle of Waters Beverage Analysis Standards Solid (p/n 186006010). The bottle containing this mixture was capped tightly and shaken vigorously until the aspartame was completely dissolved. A single point calibration method was used for quantification of samples. The concentrations of the prepared standard solution are 150 mg/L acesulfame K, 100 mg/L saccharin, 200 mg/L benzoate, 100 mg/L sorbate, 100 mg/L caffeine, and 500 mg/L aspartame.2 

Sample Preparation

Two diet colas and one regular cola from major soft drink brands were purchased at local stores. Samples of these soft drinks were ultrasonicated for 1 minute to remove carbonation and filtered through a 0.2 µm PVDF filter (p/n WAT200806). This was the only sample preparation necessary. 

Method Conditions

LC Conditions

System:

Arc HPLC System

Sample loop:

Standard (50 μL)

Column:

XBridge BEH Phenyl XP Column, 130Å, 2.5 µm, 4.6 mm x 100 mm (p/n 186006075)

Vial:

LCGC Certified Clear Glass Recovery Vial (p/n 186003270)

Temp.:

35 °C

Mobile phase:

Waters Beverage Mobile Phase Reagent (p/n 186006006)

Sample manager purge solvent:

Waters Beverage Mobile Phase Reagent (p/n 186006006)

Sample manager wash solvent:

Waters Beverage Analysis Wash Solvent (p/n 186006007)

Seal wash solvent:

Waters Beverage Analysis Wash Solvent (p/n 186006007)

Flow rate:

1.6 mL/min (isocratic)

Run time:

12.0 min

Injection volume:

5 µL

Detector:

2998 PDA Detector

Detection:

UV at 214 nm wavelength

Software:

Empower 3 CDS 

Results and Discussion

Injection Linearity and Accuracy

Figure 1 (A) shows the relationship between soft drink additive peak area and injection volume for volumes from 0.2 to 20 μL on the Arc HPLC System. The data set includes results from replicated injections at various injection volumes (n=6, injection order randomized). Lines through zero were fitted by least squares regression (no weighting) for these additives. Excellent linearity was obtained for all fitted lines (R2 > 0.9999). Figure 1 (B) shows the residual plots for the fitted lines in Figure 1 (A), which indicate the injection volume accuracy at different injection volumes. The ISO maximum permissible systematic errors3 for volumetric pipettes were also plotted in Figure 1 (B) for comparison. (The ISO limit for injection volume less than 1 μL is not available.) The observed injection volume relative errors are well within the ISO limits for pipettes. Furthermore, this level of volume accuracy is also found better than those obtained in food testing labs using volumetric pipettes.4 These results indicate that the Arc HPLC System is more accurate in delivering volume than volumetric pipettes are, at least for injection volume of 2.5 μL or larger.  

Figure 1. Arc HPLC injection linearity and accuracy in beverage analysis. (A) Relationship between peak area and injection volume for injection volumes from 0.2 to 20 μL. (B) The relative errors of observed peak area to the fitted lines at various injection volumes. The data points represent the mean value of six injections, and the error bars represent the ± RSD. The dash curves are the ISO maximum permissible systematic errors for volumetric pipettes (ISO 8655–2). 

Aspartame Degradation

Aspartame is unstable and can degrade to 5-benzyl-3,6-dioxo-2-piperazineacetic acid (diketopiperazine derivative, or DKP), aspartyl-phenylalanine (Asp-Phe), phenylalanine (Phe), and other compounds under certain conditions.1 These aspartame degradants could co-elute with additives and interfere with their quantification. Figure 2 shows a comparison of chromatograms of heated (60 °C for 5 hr and 30 hr) and unheated standard solutions. It was found that the unknown peak 7 at retention time (RT) 1.51 minutes and peak 8 at RT 3.16 minutes increased  as the standards were heated. The DKP, Phe, and Asp-Phe standards were separated under the same conditions and their RT and UV/Vis spectra were used to create a PDA UV/Vis spectral library. Using Empower Library match, Peak 7 was assigned to Asp-Phe, and peak 8 was assigned to DKP. Figure 3 shows a screen shot of the Empower UV/Vis spectral library match result.  Phenylalanine also elutes at the same RT as peak 7, but its UV/Vis spectrum does not match that of peak 7. This is in agreement with the finding that little amount of Phe was found in the soft drinks stability study.

Figure 2. Comparison of heated and unheated standard solutions. 
Figure 3. Empower UV/Vis spectral library match results for aspartame degradant peaks. 

Method Optimization

The Waters Beverage Analysis Kit is used at many soft drink manufacturing plants.5 Here, we screened the XBridge BEH Phenyl Columns with different particle sizes and column dimensions at various flow rates to achieve the optimal separation on the Arc HPLC System. The main optimization criteria assessed were run time, resolution between the Ace-K and aspartame degradant (Phe), and solvent usage. A minimum resolution value of 2.0 was used as separation criteria (Rs > 2.0) following FDA guidance.6 Table 1 shows the screening results for the 5 μm 4.6 x 150 mm column and the 2.5 μm 4.6 x 100 mm column. The 2.5 μm 4.6 x 100 mm column at 1.6 mL/min flow rate was selected as the optimal conditions for its short run time, excellent resolution, and low solvent usage. The 5 μm 4.6 x 150 mm column at 2.50 mL/min also provided satisfactory results in run time and resolution, but its solvent use was high and the plate count was relatively low. Smaller XBridge BEH Phenyl 2.5 μm Columns, such as 3 x 100 mm and 4.6 x 75 mm, were also screened, but the resolutions between Ace-K and Phe were less than 2.0. (Results not included in Table 1). It is worth mentioning that the operating pressure limit of the Arc HPLC (9000 psi) allows the analysis to be run at higher flow rates (see Table 1), resulting in shorter run times (12 minutes).  

Table 1. Column screening results for the optimization of the beverage analysis on Arc HPLC System. 

Soft Drink Sample Analysis

Figure 4 shows chromatograms of three soft drink samples (SD1, SD2, and SD3) and the determined additive concentrations. Table 2 shows sample analysis results for these soft drink samples. The determined caffeine contents were 98.5%–100% of the labeled caffeine value on the product package. The RSDr (repeatability precision) of less than 0.4% and the RSDir (intermediate precision) of less than 1.16% were obtained for all measurements.

Figure 4. Chromatograms of soft drinks and the determined additive concentrations. 
Table 2. Soft drink sample analysis results. 

These soft drink samples have caffeine levels from 107 mg/L to 192 mg/L, which are higher than the caffeine level in the beverage analysis standard. Normally, dilution of samples is needed to fit the samples’ caffeine peak area within the calibration range. Here, to take advantage of  the Arc HPLC System’s excellent injection volume accuracy (as shown in Figure 1), smaller volumes of soft drink samples (4 μL for SD1 and SD2, and 2.5 μL for SD3) were injected to fit the samples’ caffeine peak area within the calibration range (see Figure 4). This improves the workflow efficiency and eliminates human error that could be introduced in manual sample dilution. The small change to the injection volume of samples and standards did not affect the separation and quantification. 

Conclusion

This application note demonstrates a fast, simple, and accurate method for the analysis of soft drink additives on the Waters Arc HPLC System with PDA detection using the Waters Beverage Analysis Kit. Aspartame degradant peaks were identified and their potential interference to the quantification of the target additives was eliminated under the optimized conditions. Excellent injection accuracy of the Arc HPLC System meets the ISO requirement for volumetric pipettes, which makes the injection of a smaller sample volume an acceptable alternative to the dilution of samples to fit the response to the calibration range. Implementation of this beverage analysis on the Arc HPLC System using the Waters Beverage Analysis Kit can improve the overall productivity in a soft drink manufacturing environment and has the following key benefits:

  • Quality control of the soft drink additives in a 12-minute isocratic run.
  • No interference from aspartame degradation products to the quantification of additives.
  • Injecting smaller sample volumes for high additive content samples, minimizing manual sample dilution operation.
  • Pre-formulated mobile phase, wash solvent, and standards for easy setup and preparation.
  • Ethanol-based mobile phase and wash solvent for low disposal costs.

References

  1. Van Vliet K, Melis ES, de Blaauw P, van Dam E, Maatman RGHJ, Abeln D, van Spronsen FJ, Heiner-Fokkema MR. Aspartame and Phe-Containing Degradation Products in Soft Drinks across Europe. Nutrients 2020, 12, 1887. 
  2. If the concentrations of sodium saccharin, sodium benzoate and potassium sorbate are desired, then the concentrations are 113 mg/L sodium saccharin, 238 mg/L sodium benzoate and 135 mg/L potassium sorbate, which are converted based on the ratios of the molecular weight of different forms. 
  3. International Organization for Standardization. (2002). Piston-operated volumetric apparatus – Part 2: Piston pipettes (ISO Standard No. 8655–2:2002(E)). https://www.iso.org/standard/29727.html.
  4. Liu K, Pointer B, Yang J, Skinner N, Toerber S, Karote D. Automate Standard Preparations for Food Analyses – A Real-World Evaluation. Waters Application Note 720007126EN, Jan 2021. 
  5. Ensuring Compositional Accuracy During Soft Drink Manufacturing. Waters Business Solution 720004489EN, Dec 2012. 
  6. FDA Center for Drug Evaluation and Research. (November 1994). Reviewer Guidance, Validation of Chromatographic Methods https://www.fda.gov/media/75643/download

720007219, April 2021

Back To Top Back To Top