This application note investigates whether untargeted metabolomics could differentiate honey samples from polyfloral and single botanical origin and detect illicit fortification of a honey supplement, using a novel high-performance bench-top orthogonal acceleration time-of-flight (Tof) LC-MS system with simplified and optimized standard operation modes with intuitive software and automated workflow methods including multivariate statistics.
The ACQUITY RDa Detector as a tool for investigating typical frauds associated with honey offers streamlined data acquisition and processing on a fit-for-purpose high-resolution LC-MS (Tof) platform enhancing accessibility to new users that take first steps in the analysis of food integrity.
A new orientation of consumers towards a healthy and natural lifestyle has recently given rise to a growing global market for honey. Antioxidants and anti-inflammatory components, besides others, make honey an attractive alternative to natural sugars, syrups, and artificial sweeteners for the food and beverage industry. Recently, however, honey has also seen growing interest as an ingredient within the pharmaceutical and consumer products ranging from wound dressings to cold remedies.1
Honey, as a high value food commodity is vulnerable to various forms of food fraud. For example, specialty monofloral honey products, like Manuka, face adulteration to undercut competition, ultimately taking genuine beekeepers out of business as they cannot compete with the price of adulterated products, with severe effects on local ecosystems and agriculture. A third of our food depends on bees and protecting global bee populations by keeping the producers in operation and fighting economic honey fraud remains an ongoing challenge on many levels.2 In addition, natural health supplements containing honey that make various health and nutrition claims, but are often illicitly fortified with undeclared pharmaceutically active compounds to deliver the purported “efficacy” of the product, can be a risk to consumer safety.
Food and drink manufacturers rely on their supply chains to ensure consumer choice, affordability, consistent quality of products, and continuity of supply. As the global supply system is under increasing pressure from population increase, growing demand for limited resources and changing diets, companies also need to be alert to the potential for food fraud and actively work with their customers and suppliers to identify and mitigate the risks of food fraud.
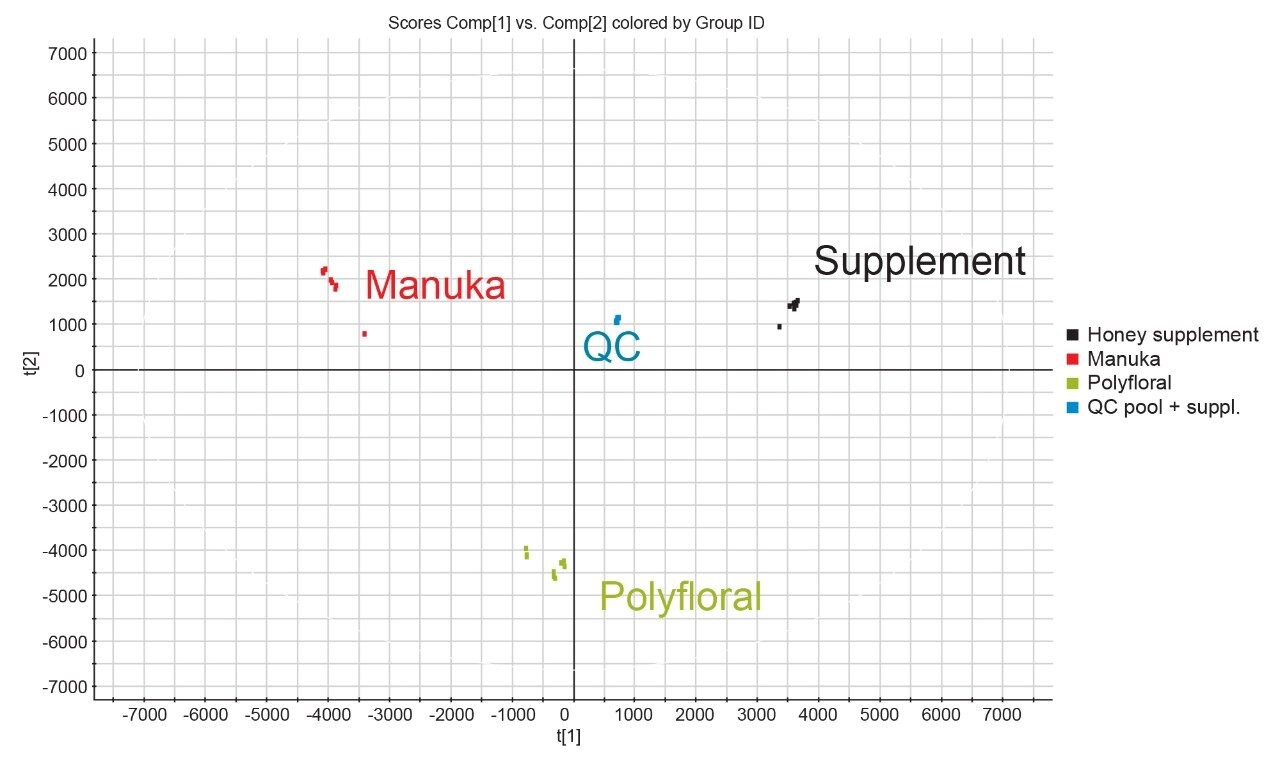
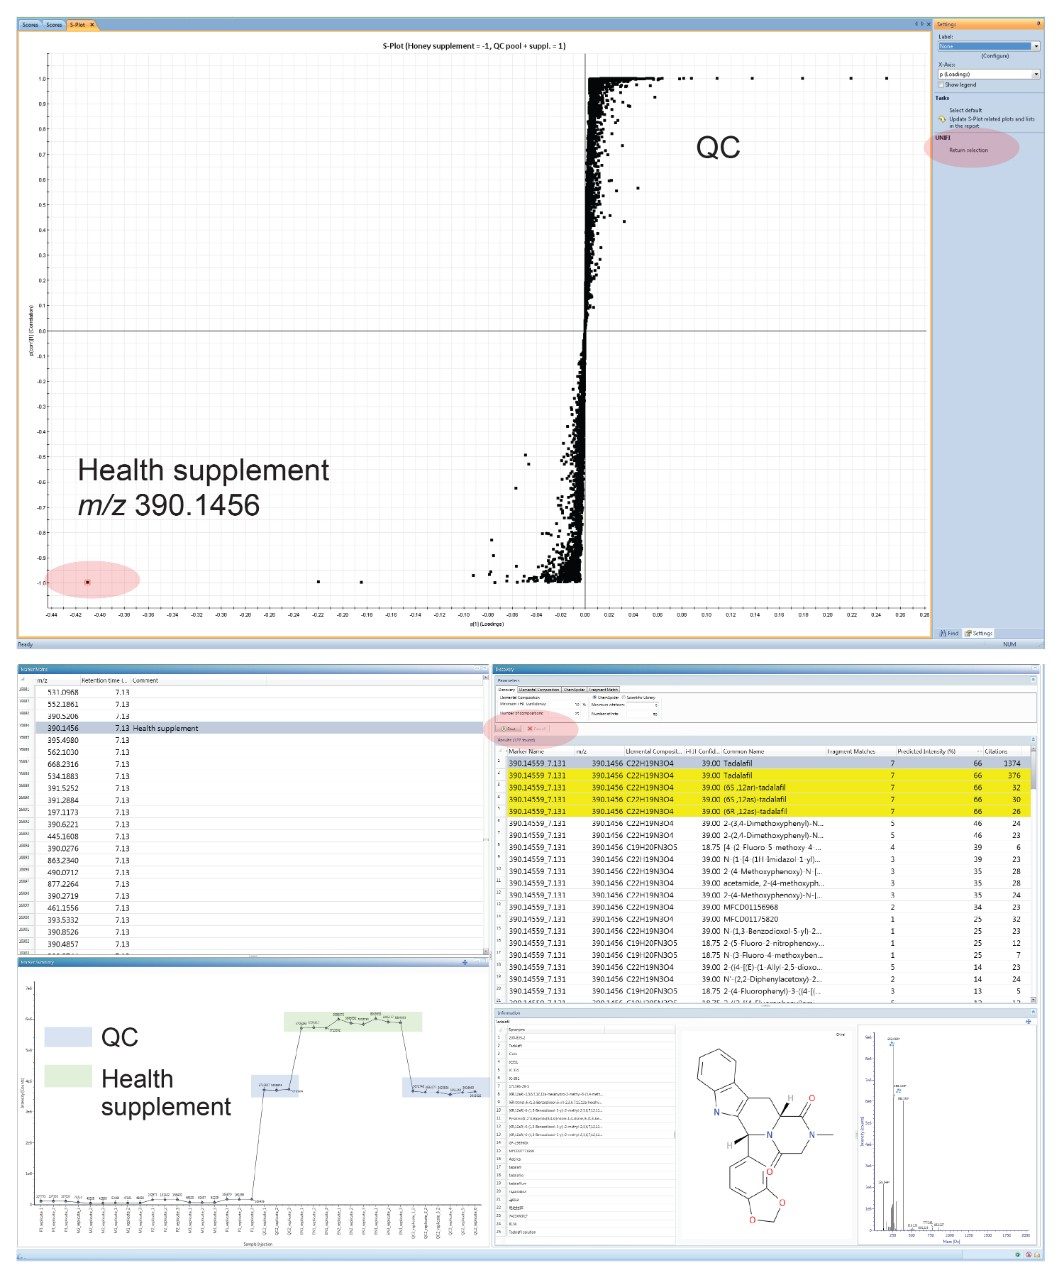
Honey analysis is highly complex and requires the use of multiple analytical techniques as adulteration types can be numerous. The simultaneous detection of multiple components using spectroscopic and spectrometric techniques, coupled with multivariate analysis (MVA), is a promising approach to achieve botanical discrimination.3 LC-HRMS is one technique that has been used extensively for metabolic profiling in the food and beverage industry including for the analysis of honey. In this study we investigated whether untargeted metabolomics could differentiate honey samples from polyfloral and single botanical origin and detect illicit fortification of a honey supplement, using a novel high-performance bench-top orthogonal acceleration time-of-flight LC-MS system with simplified and optimized standard operation modes with intuitive software and automated workflow methods including multivariate statistics.
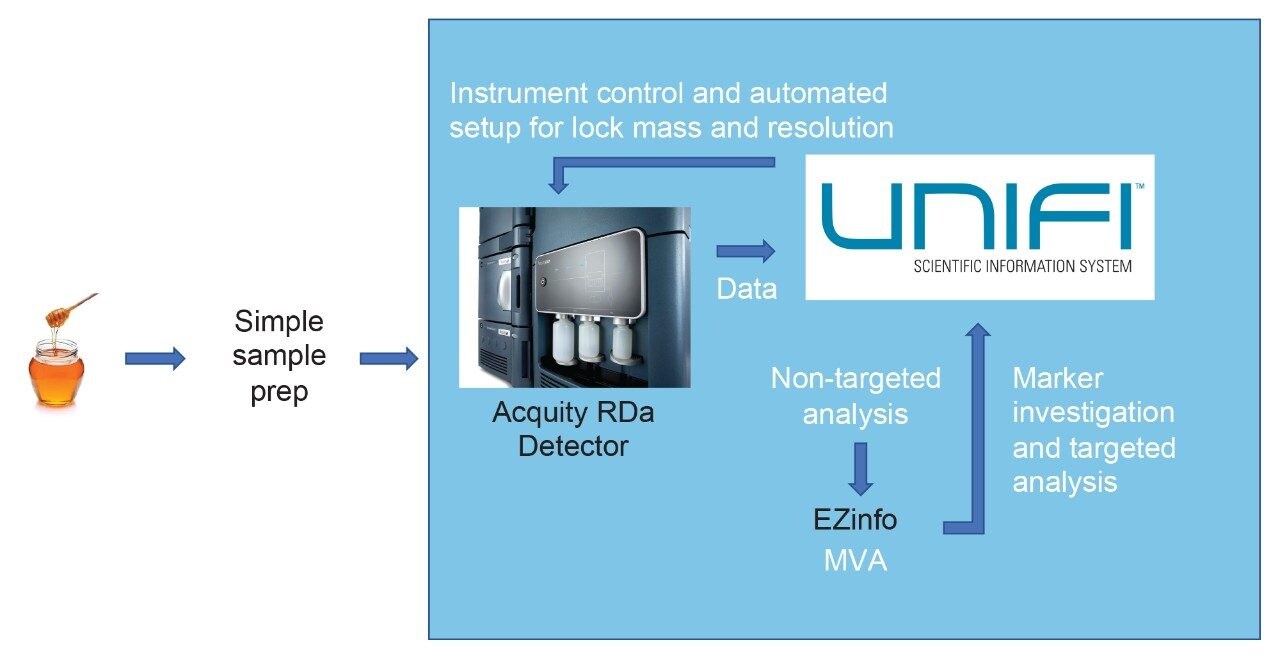
The system is controlled by UNIFI Software which facilitates the operation by automating the setup and calibration routines as well as the processing through an established non-targeted screening workflow, illustrated in Figure 1.
Honey samples of polyfloral and a single floral origin (Manuka) were analyzed. Three different samples per type were selected and injected in triplicate (a total of 9 data points per group). A single honey health supplement was also investigated. A quality control (QC) pool was generated, to evaluate the technical repeatability of the assay.
A fast and simplified sample preparation was chosen which takes about 30 minutes to conduct for batches of up to 40 samples. Briefly, 1 mL of honey was weighed into a centrifuge tube, combined with 20 mL of extraction solvent (methanol/water (30/70%, v/v) with 0.1% formic acid) and centrifuged at 5000 rpm for five minutes and the supernatant was sonicated for one minute at 30 °C. Subsequently 1 mL of the sample extract was transferred to UPLC glass vials and five microliters were injected and separated on an ACQUITY UPLC I-Class PLUS coupled to an ACQUITY RDa Detector. The workflow is shown in Figure 1.
This instrument uses built-in SmartMS Technology to improve the setup for users new to high-resolution instruments. With the ACQUITY RDa System, the setup solution is permanently connected to the instrument and the instrument setup is presented to the operator on an optimized page. The system automatically completes the detector setup, auto-tune and mass calibration and displays when it is ready to acquire.
The data was acquired and processed using UNIFI on waters_connect (version 1.2.0, Waters) with EZinfo (version 3.0.3, Umetrics) performing the peak picking in UNIFI and the multivariate analysis in EZinfo. Prior to processing, the sample list in UNIFI was edited with an additional column for ‘Group ID’ which automates marker labelling in EZinfo. Mass range and retention time limits were set to full range for marker discovery, resulting in about 40,000 markers generated by UNIFI. The markers were transferred via an automated routine to EZinfo for multivariate analysis. Model scaling was set to Pareto and labels were changed to ‘Group ID’. An S-Plot was generated for a comparison of the measured health supplement honey and the quality control pool.
LC System: |
ACQUITY UPLC I-CLASS PLUS |
Column: |
ACQUITY BEH C18 2.1 x 100 mm, 1.7 µm |
Mobile phase A: |
10 mM ammonium acetate in water |
Mobile phase B: |
Acetonitrile |
Column temperature: |
45 °C |
Injection volume: |
5 µl |
Time(min) |
Mobile phase B (%) |
Curve settings |
---|---|---|
0.0 |
1 |
Initial |
0.75 |
1 |
6 |
2.0 |
5 |
6 |
3.0 |
5 |
6 |
6.5 |
55 |
6 |
8.5 |
90 |
6 |
9.0 |
90 |
6 |
9.1 |
1 |
6 |
12.0 |
1 |
6 |
MS Detector: |
ACQUITY RDa Detector |
Mode: |
Full scan with fragmentation (pseudo-MSE acquisition) |
Mass range: |
Low (50-2000 m/z) |
Polarity: |
Positive |
Scan rate: |
10 Hz |
Cone voltage: |
30 V |
Fragmentation cone voltage: |
60-180 V |
Capillary voltage: |
1.5 kV |
Desolvation temperature: |
550 °C |
Using the 10k resolution LC-Tof with unsupervised MVA (PCA) honey samples were readily discriminated according to poly- and mono-floral variety showing good intra- and inter-group clustering. Replicate injections of the QC pool sample were included at randomized intervals throughout the course of the acquisition to assess technical variance. The QC pool injections were found to cluster in very close proximity, falling between the poly- and mono-floral honey populations in the PCA scores plot indicating the technical variance of the overall system is low and fit-for-purpose for multi-variate analysis.
Figure 2 reveals the discrimination between the tested groups of honey according to poly- or mono-floral origin, honey health supplement, and the pooled QC sample. The health supplement honey groups distinctly away from the other groups and was investigated separately within EZinfo against the QC pools. Also visible are pronounced intra-group differences between the three polyfloral and the three Manuka honey samples.
The health honey supplement showed an abundant, unique marker ion (m/z of 390.1456) in the generated S-plot (Figure 3).
The selected marker was tentatively identified as the pharmaceutical compound tadalafil, following a Chemspider search with the precursor mass and fragment ion confirmation which was enabled by the pseudo-MSE acquisition with cone voltage ramping that was used for initial data acquisition. The investigation was performed in UNIFI after re-importing the marker of interest from the S-plot in EZinfo with three clicks as shown in Figure 3.
In the lower left corner of Figure 3 an automatically generated marker summary plot is displayed in UNIFI, which shows the abundance of the selected marker across the sample set. EN1, EN2, and EN3 are the honey health supplement injections obtained from three different aliquots of the product. QC2 is the QC pool containing the health supplement which is referred to in this document as the QC pool.
After marker identification a quantitative analysis of the tadalafil standard was performed. A library entry was created in UNIFI and a molfile downloaded from Chemspider was added to that entry (Figure 5) allowing UNIFI to generate predicted fragments from the structure and look for these in the pseudo-MSE data. Afterwards the processing method in UNIFI was updated by adding the new tadalafil library entry and the data was reprocessed for threshold estimation. Non-linear curve fitting was applied within UNIFI and showed an R2 of 0.994 over 500 to 3000 ng/mL (Figure 4). The calculated concentration of tadalafil in the honey based health supplement was estimated to exceed the maximum formulation dosage in the pharmaceutical product Cialis thus posing a potential health risk to the unsuspecting consumer. This functionality is a powerful aspect for the estimation of adulterant levels prior to subsequent analysis required for full quantitative analysis.
720007087, January 2021