Analysis of Metformin and its Impurities Using Hydrophilic Interaction Liquid Chromatography (HILIC) Coupled With Ultraviolet (UV) and Mass Spectrometry (MS) Detection
Abstract
Diabetes is a leading cause of death in the United States, thus the medications used to manage it are important to society. Metformin is a common first line treatment for diabetes, specifically type II diabetes. In this study, HILIC combined with MS and UV detection allows for the retention, separation, and identification of the polar drug Metformin and its related Impurities. This method has been shown to be linear and reproducible when quantitating Metformin in drug substance. Moreover, testing of multiple lots of stationary phase demonstrated reproducible results.
Benefits
- A quick, single method that can retain and separate Metformin and the related impurities
- The method is compatible with MS, for effective identification and detection of chromophore lacking impurities
- Accurate and precise linearity provides a method for the quantitation of Metformin drug substances
Introduction
According to the CDC, 37.3 million Americans are afflicted with diabetes, and it is currently the seventh leading cause of death in the United States.1 Of those 37.3 million, 90% of them have Type II diabetes. Metformin is commonly recommended as the initial medication for the treatment of Type II diabetes.2 The prevalence and severity of Type II diabetes demands that pharmaceutical companies who manufacture Metformin medications use effective methodologies to perform quality control testing. Here, we developed a quick and reliable method for the retention, separation, and identification of Metformin and its impurities using HILIC in combination with UV and MS detection.
HILIC functions inversely to traditional reversed phase liquid chromatography (RPLC)3 and is an ideal technique for retaining and separating polar compounds.4 In this method, the Atlantis™ Premier BEH™ Z-HILIC Column was used. Z-HILIC, or Zwitterionic HILIC, refers to the sulfobetaine functional group that is attached to the ethylene-bridge hybrid particle packed within the column. This functional group creates a dense water rich layer at the particles surface, which in combination with the organic-aqueous partitioning mechanism of HILIC retains and separates Metformin and its impurities.
In this study, HILIC combined with MS and UV detection allows for the retention, separation, and identification of the polar drug Metformin and its related Impurities. This method has been shown to be linear and reproducible when quantitating Metformin in drug samples. Moreover, testing of multiple lots of stationary phase demonstrated reproducible results.
Experimental
Method of Separation Sample Description
Metformin Hydrochloride, Impurity A (Cyanoguanidine), Impurity C (N,N-Dimethyl-1,3,5-triazine-2,4,6-triamine), Impurity D (2,4,6-Triamino-1,3,5-triazine), Impurity E (1-Methylbiguanide monohydrochloride), and Impurity F (Dimethylamine hydrochloride) were purchased from Sigma Aldrich (Milwaukee, WI). Impurity B ((4,6-diamino-1,3,5-triazin-2-yl) guanidine Dihydrochloride) was purchased from Toronto Research Chemicals (Toronto, Canada). Individual stock standard solutions were prepared in 80:20 acetonitrile: deionized water. Then, the stock standards were combined such that the concentration of impurities and Metformin were at 10 µg/mL 100 µg/mL, respectively, using 80:20 acetonitrile:deionized water. Solutions were stored at 2 °C–8 °C and allowed to equilibrate to ambient room temperature prior to analysis.
Linearity Sample Description
Metformin Hydrochloride stock solution was prepared at a 1 mg/mL concentration in 80% acetonitrile. Then, the stock solution was diluted using 80:20 acetonitrile:deionized water into various calibration standards ranging from 50 µg/mL to 150 µg/mL.
Metformin drug tablets (500 mg) were provided by an external vendor. The drug tablets were prepared by weighing 5 drug tablets and establishing the ratio between Metformin content and tablet mass. Then, the tablets were pulverized using a mortar and pestle. The pulverized tablets were weighed and diluted so that the resulting concentrations of the diluent and drug sample were 80% acetonitrile and 100 µg/mL, respectively. The 100 µg/mL drug tablet sample was filtered using a 13 mm 0.2 µm Nylon syringe filter before analysis.
Method Conditions
Two detectors we utilized in this method. Flow was arranged so that it would pass through the non-destructive UV detector then flow into the destructive MS detector. Further, a diverter valve was used. The diverter directed flow from the UV to waste when the Metformin peak was eluting. This prevented over saturation of the QDa™, since the Metformin is at a higher concentration than that of its impurities.
LC Conditions
|
LC system: |
Arc™ Premier LC System |
|
Detection: |
Waters 2998 Photodiode Array Detector, 240 nm Waters ACQUITY QDa Mass Detector |
|
Column(s): |
Atlantis Premier BEH Z-HILIC, 4.6 x 100 mm, 2.5 µm |
|
Column temp.: |
40 °C |
|
Sample temp.: |
15 °C |
|
Injection volume: |
10 µL |
|
Flow rate: |
1.4 mL/min |
|
Mobile phase A: |
90:10 Acetonitrile:deionized water with 10mM Ammonium formate and 0.1% formic acid |
|
Mobile phase B: |
Deionized water with 10 mM Ammonium Formate and 0.1% formic acid |
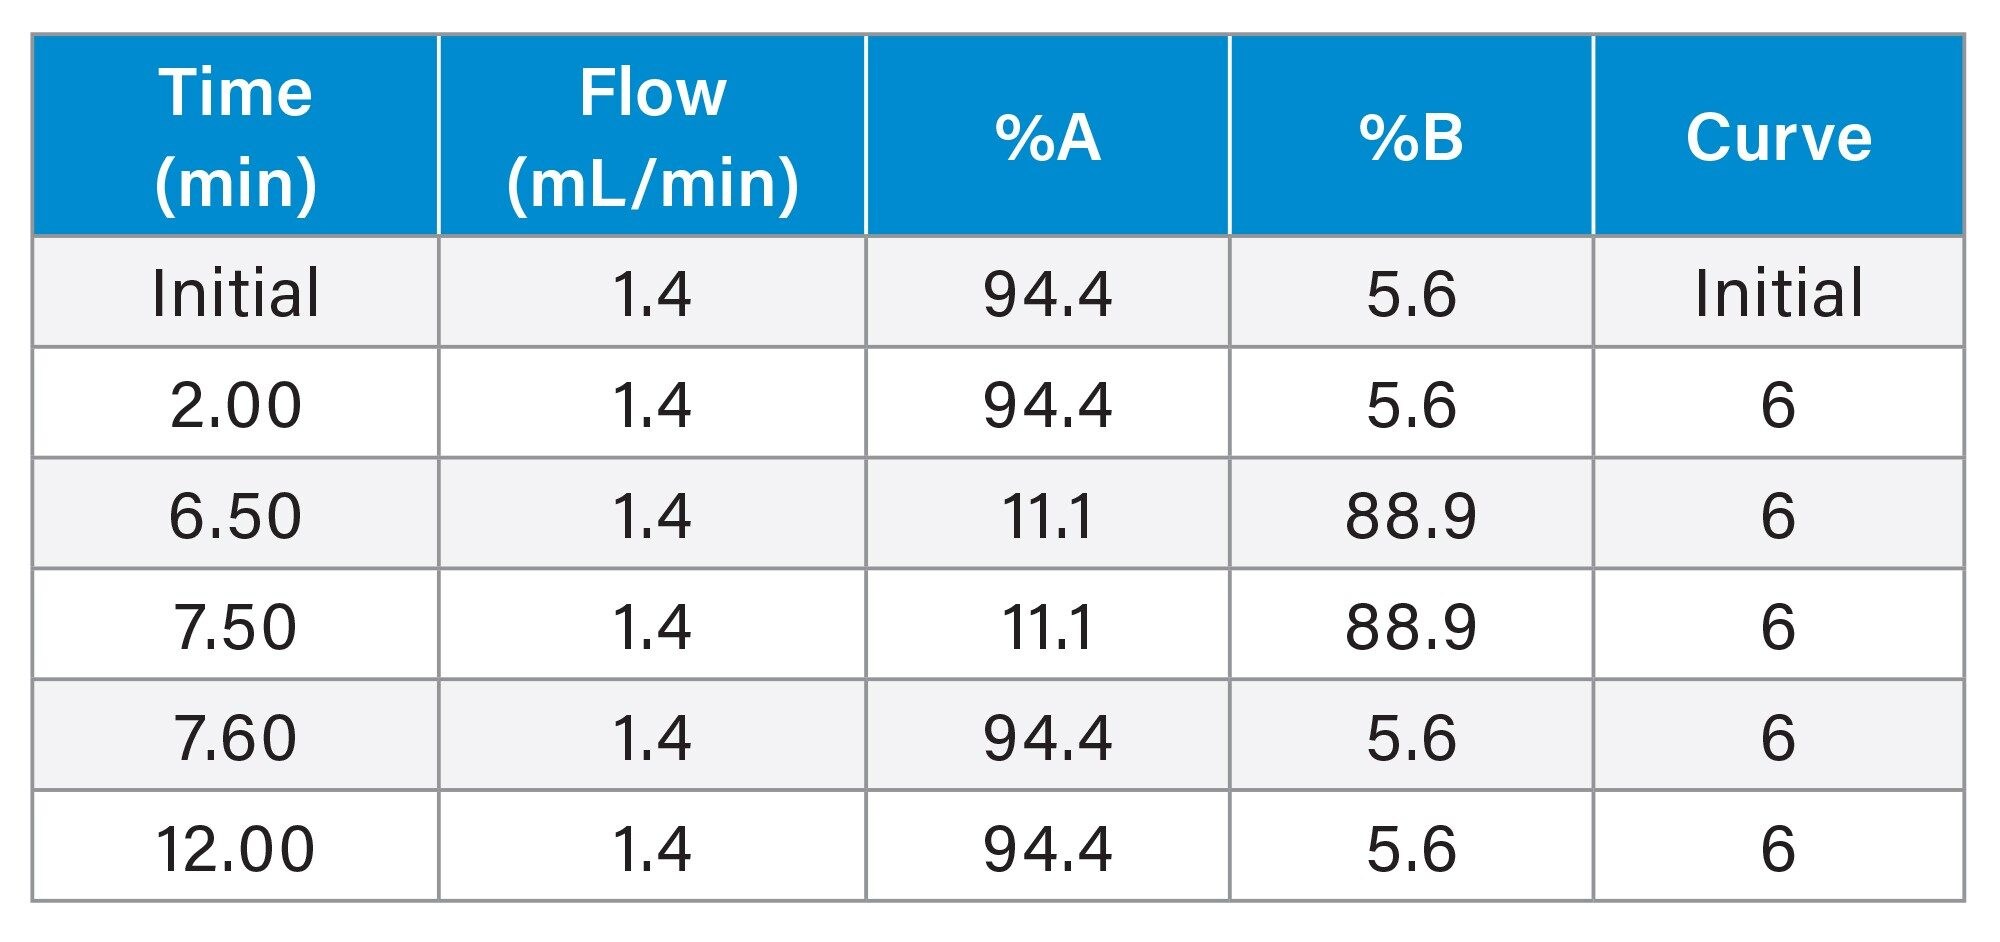
Gradient Table
MS Conditions
|
MS system: |
Waters ACQUITY QDa Mass Detector |
|
Ionization mode: |
ESI+ |
|
Acquisition range: |
40 amu to 300 amu |
|
Capillary voltage: |
0.8 kV |
|
Cone voltage: |
15 V |
Data Management
|
Chromatography software: |
Waters Empower™ 3 Software |
Results and Discussion
This method displayed good reproducibility in the specificity and retention of Metformin and its associated impurities.
Over the course of six injections, the %RSD was ≤6% for area and ≤1% for retention time for the analytes (Table 1 and Table 2). The blank injection demonstrates there are no interfering peaks between the diluent and the standard peaks (Figure 1a). The overlay chromatogram gives a clear picture on the reproducibility of this method (Figure 1b).
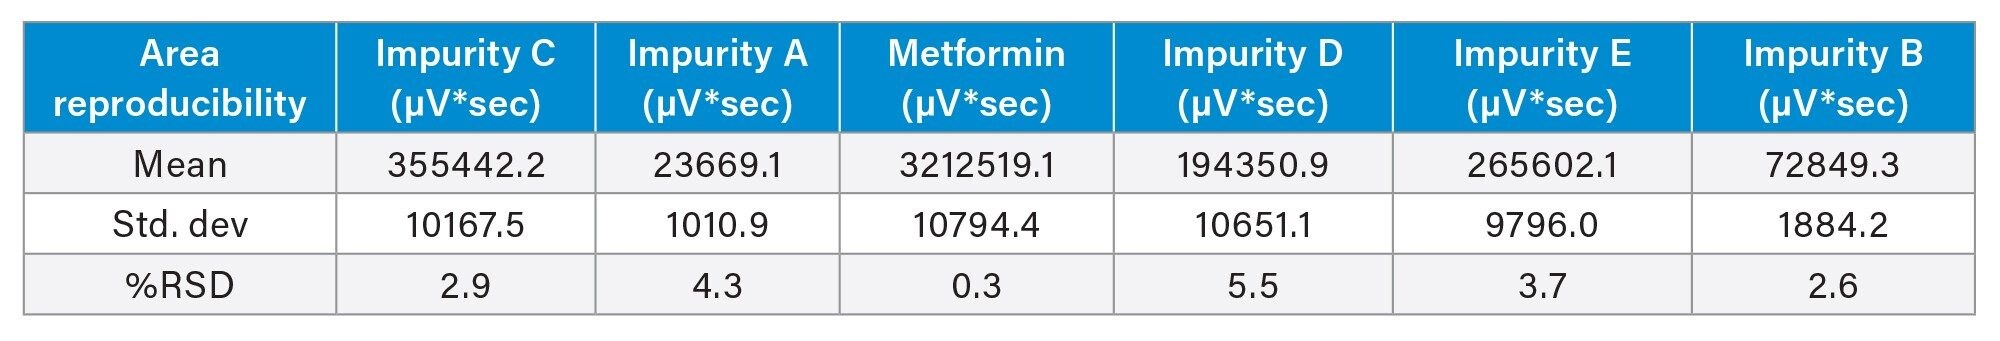 Table 1. Table containing the %RSDs for the area counts from the Metformin and Impurities standard mixture. Note, impurity F is not detectable using UV therefore there is no UV data.
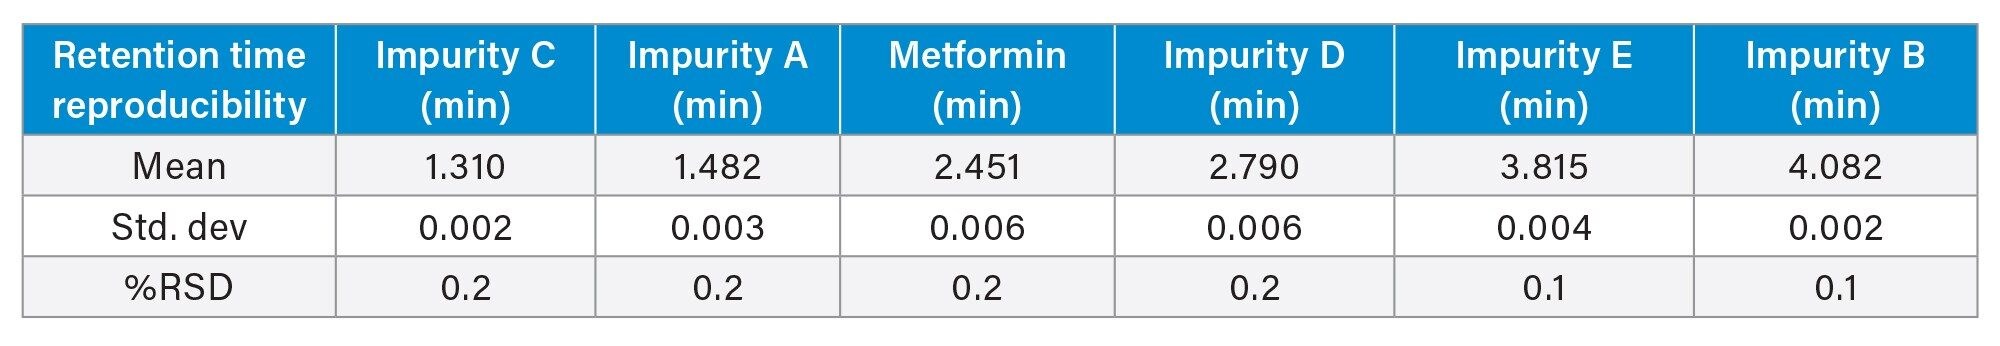 Table 2. Table containing the %RSDs for the retention times from the Metformin and Impurities standard mixture. Note, impurity F is not detectable using UV therefore there is no UV data.
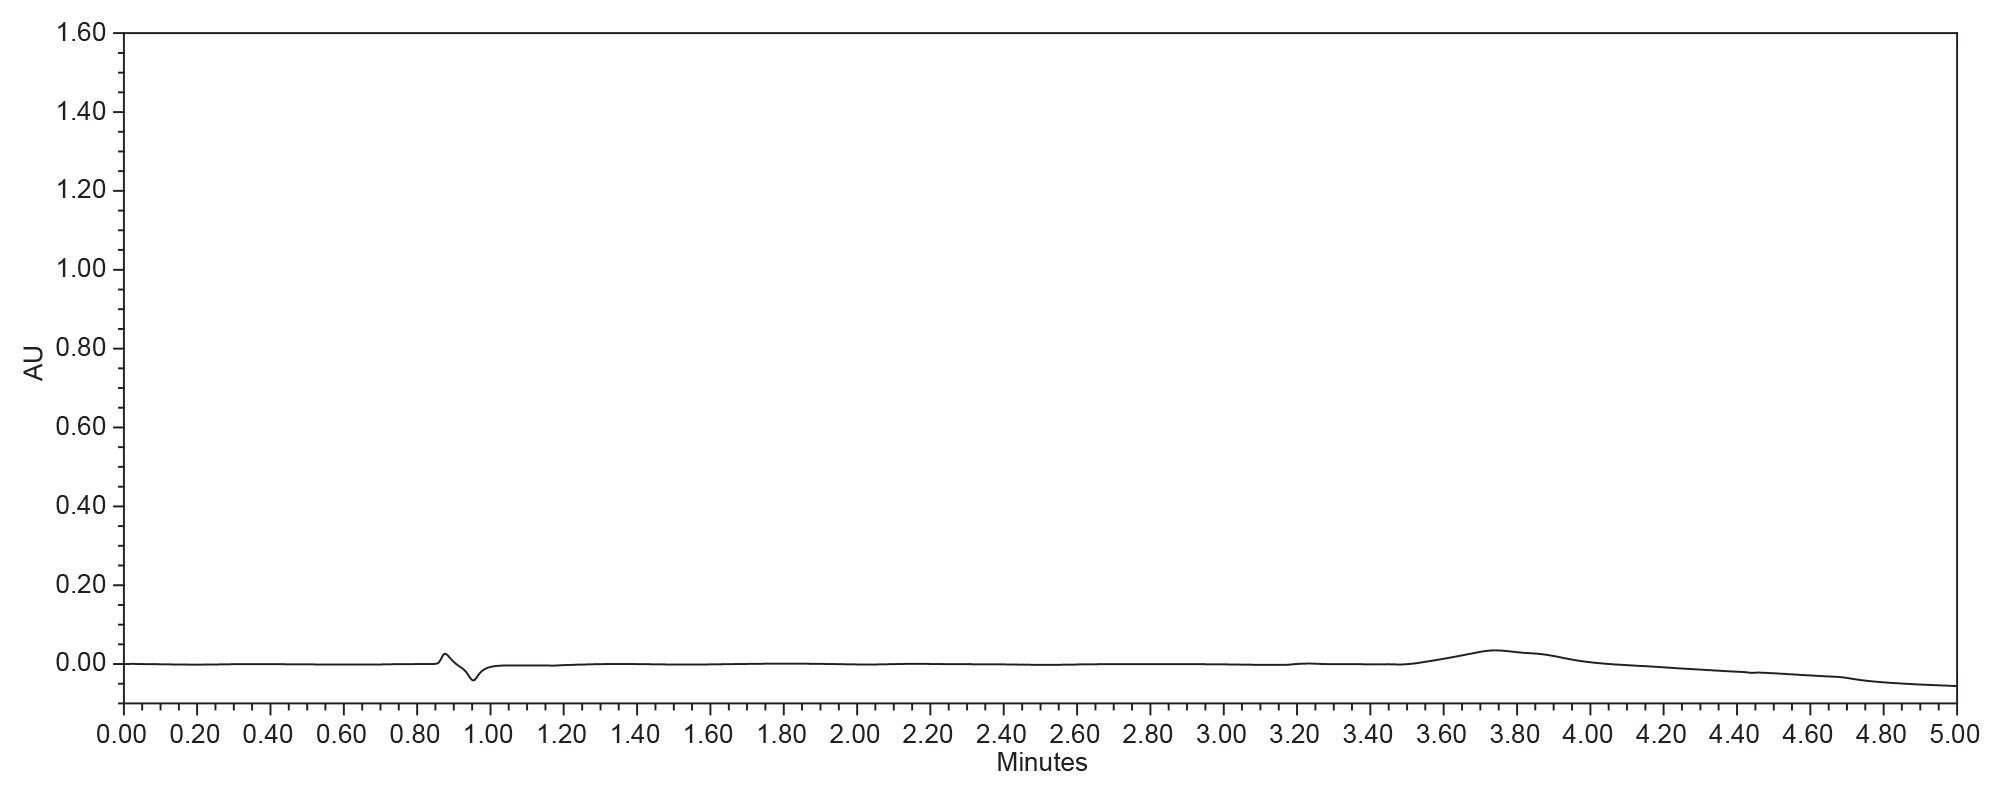 Figure 1a. A blank injection of the sample diluent (80:20 acetonitrile:deionized water).
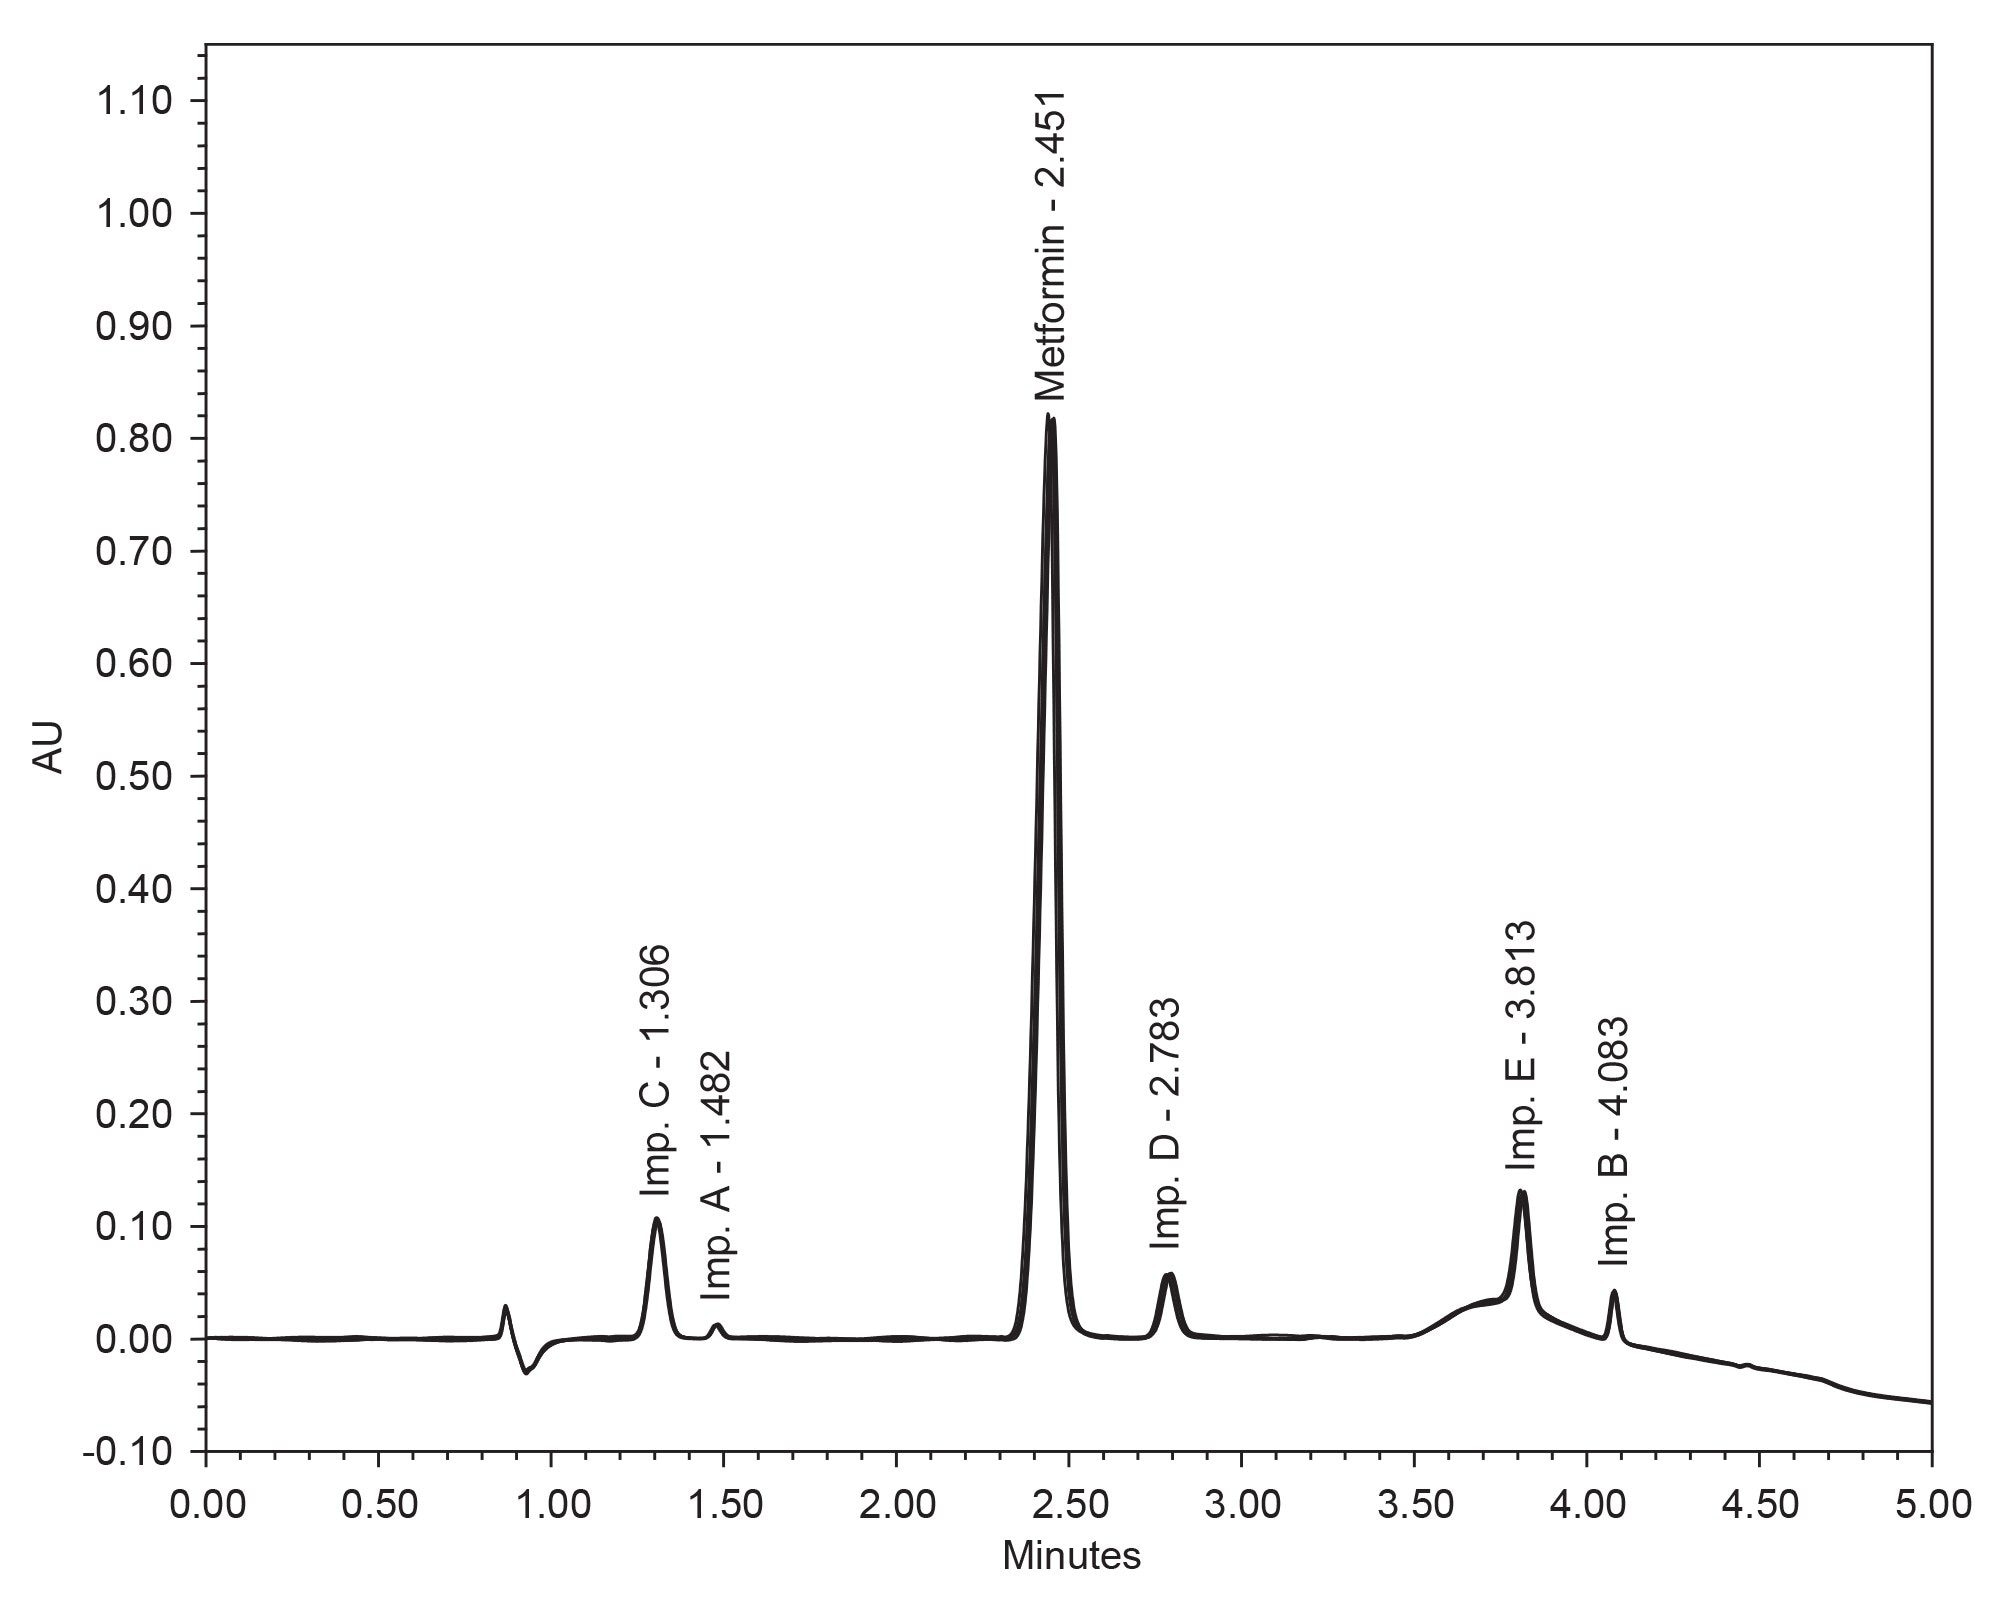 Figure 1b. An overlay chromatogram of six injections of the Metformin and Impurities standard. Note, Impurity F is not visible using UV detection.
Mass spectra data was also collected during this study. The mass spectra data aids in the identification of the impurities seen in the UV, but also gives visibility to Impurity F (Figure 2A and Figure 2B). Due to the instrument set up, there is a slight delay in MS detection, when compared to the UV retention times.
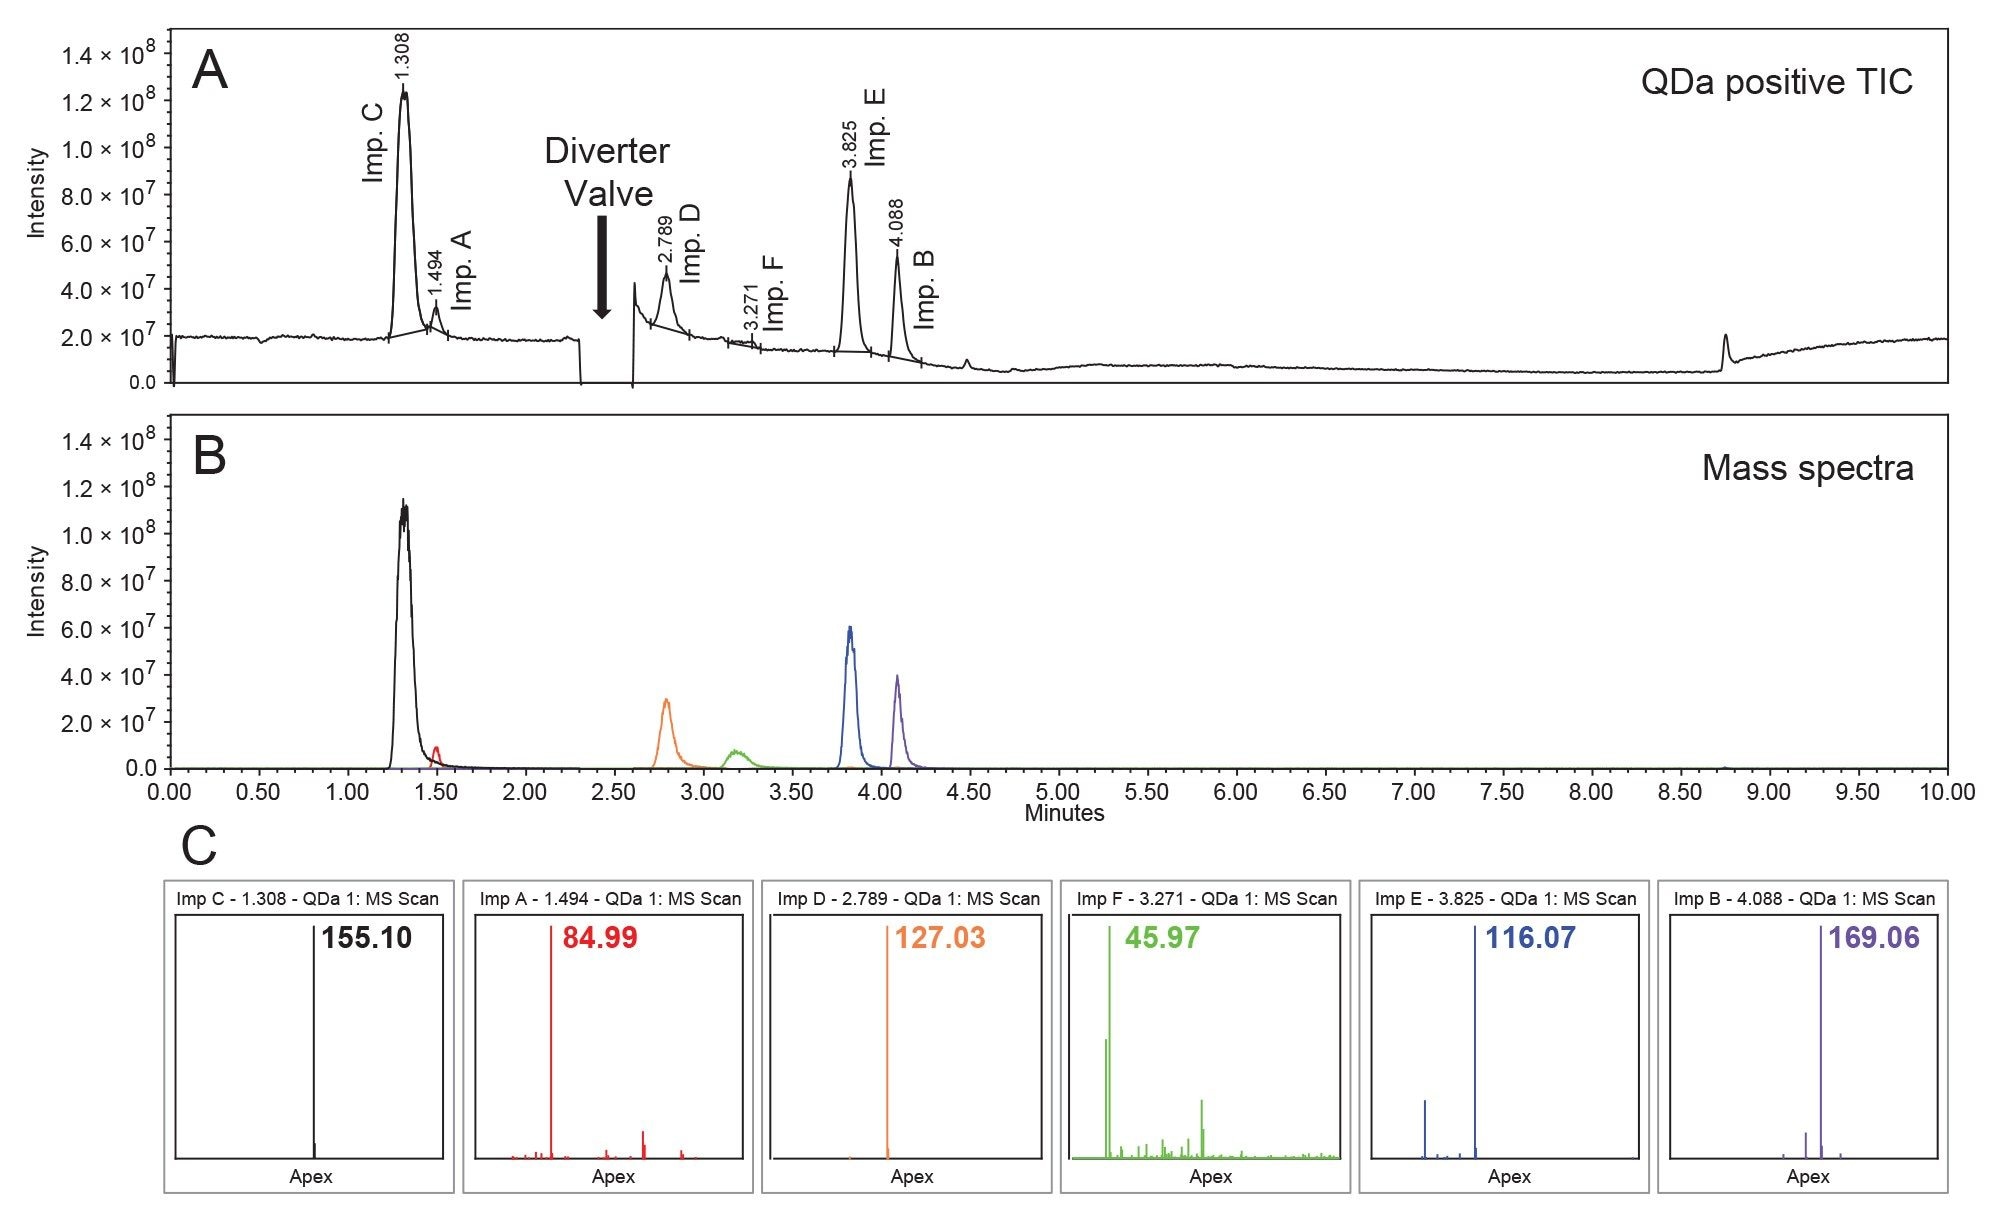 Figure 2A. Total ion chromatogram (TIC) of the Metformin and Impurities standard. Between Impurity A and Impurity D, the drop in signal is caused by flow diversion from the QDa to waste. This is done to prevent the Metformin peak from oversaturating the detector. Therefore, there is no MS data for Metformin.
Figure 2B. An overlay chromatogram of the extracted ion chromatogram (XIC) for each detected mass in the TIC (Figure 2A).
Figure 2C. The mass spectra base peaks (m/z) for each peak (Figure 2B). These masses were used to identify the impurities. All the masses, except for impurity F, are the reported precursor masses for each of the impurities.
The masses presented in Figure 2C are supported by data found on the PubChem data base (Table 3).5–10
 Table 3. The previously document masses for Metformin impurities according to literature.
 *Considers the dissolution of the hydrochloride in solution.
**Considers previously acquired mass spectrometry data.
Linear data collected for Metformin demonstrates the method developed is appropriate for quantitative purposes (Figure 3 and Figure 4).
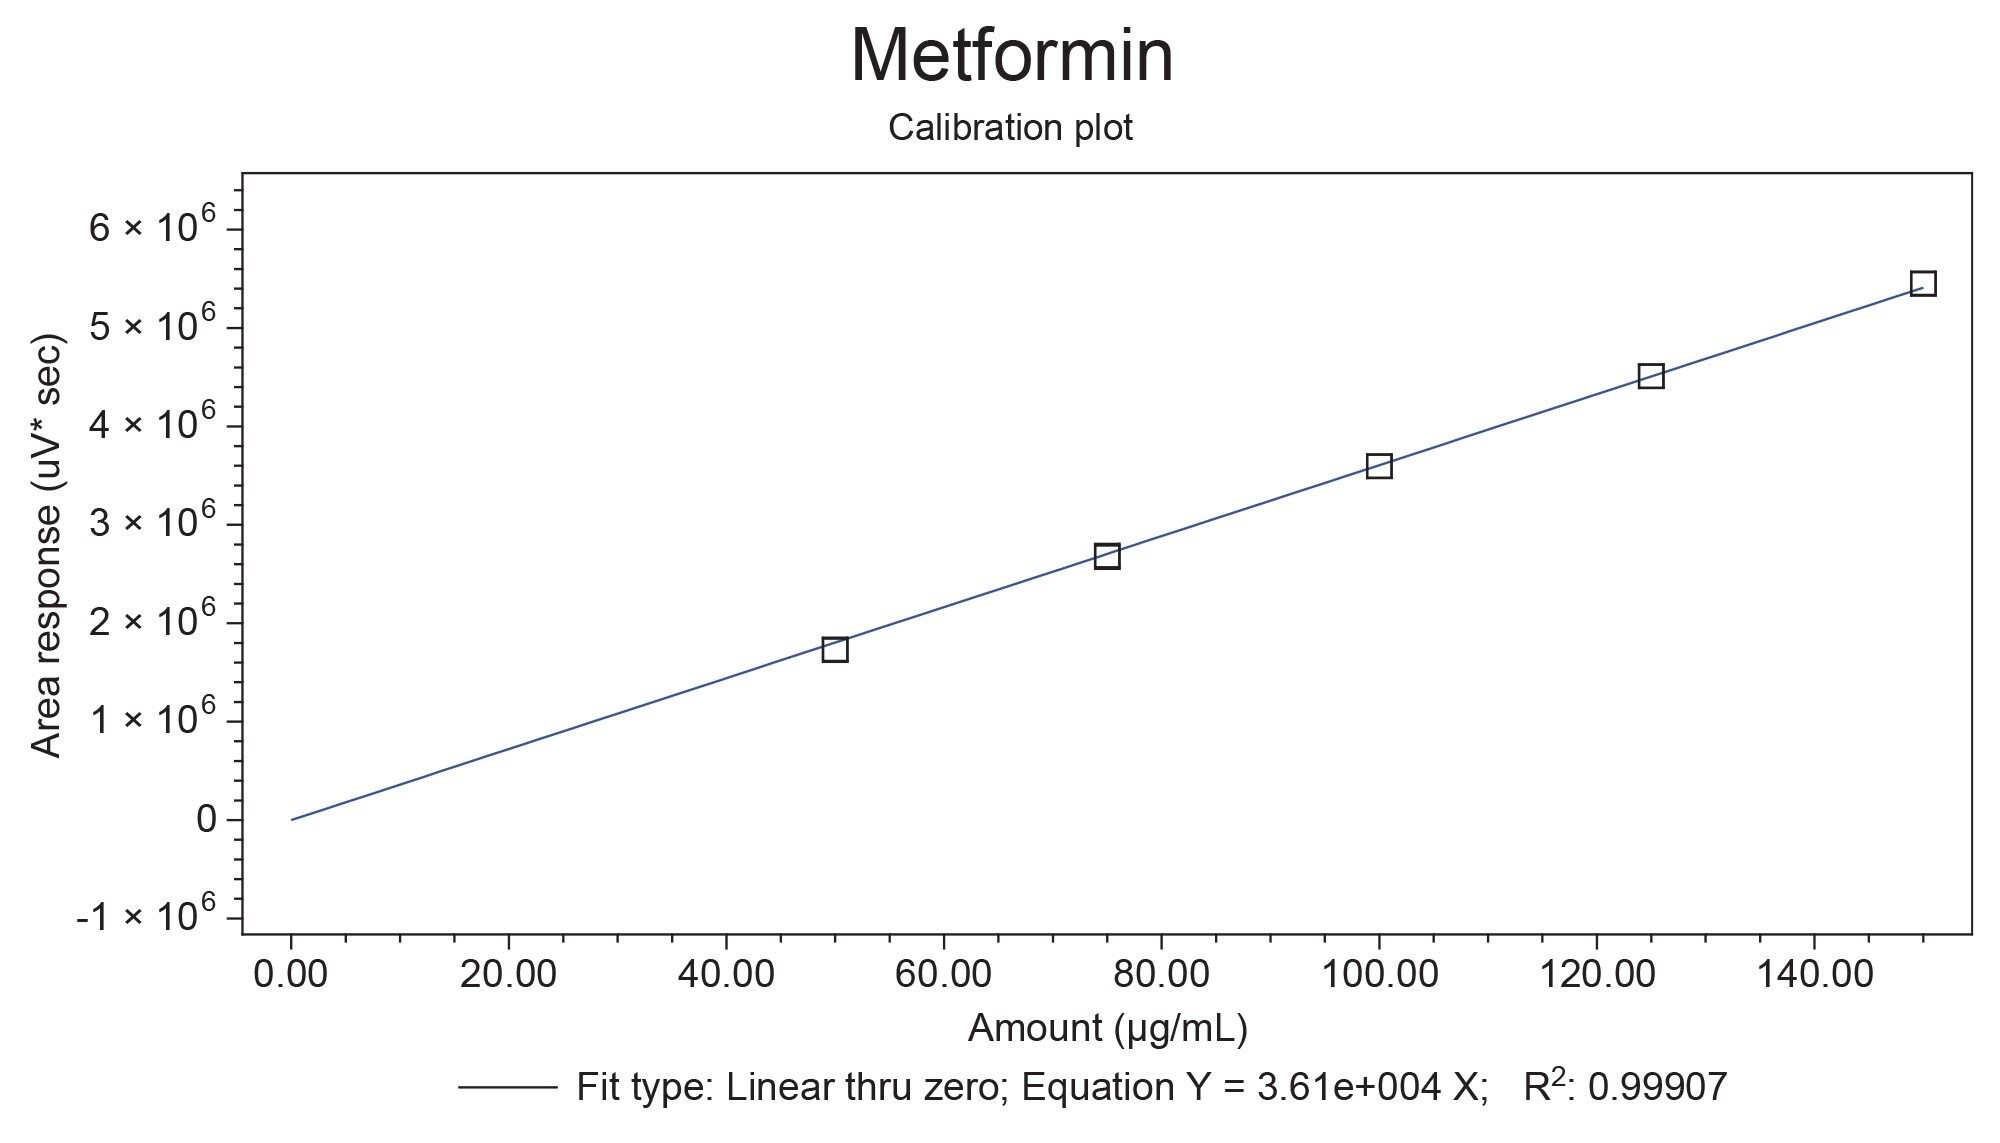 Figure 3. The calibration plot for Metformin spanning from 50 µg/mL to 150 µg/mL
The R2 value for the Metformin curve was ≥0.999. The above curve was used to quantify a generic Metformin Hydrochloride drug sample (Fig. 4C).
The samples were filtered using a nylon syringe filter to prevent any contamination to the system from dissolved drug excipients. To ensure that no Metformin is being consumed by the filter a filter recovery sample was run (Figure 4A and Figure 4B). A Metformin drug sample was quantitated without any interference from the drug excipients (Figure 4C).
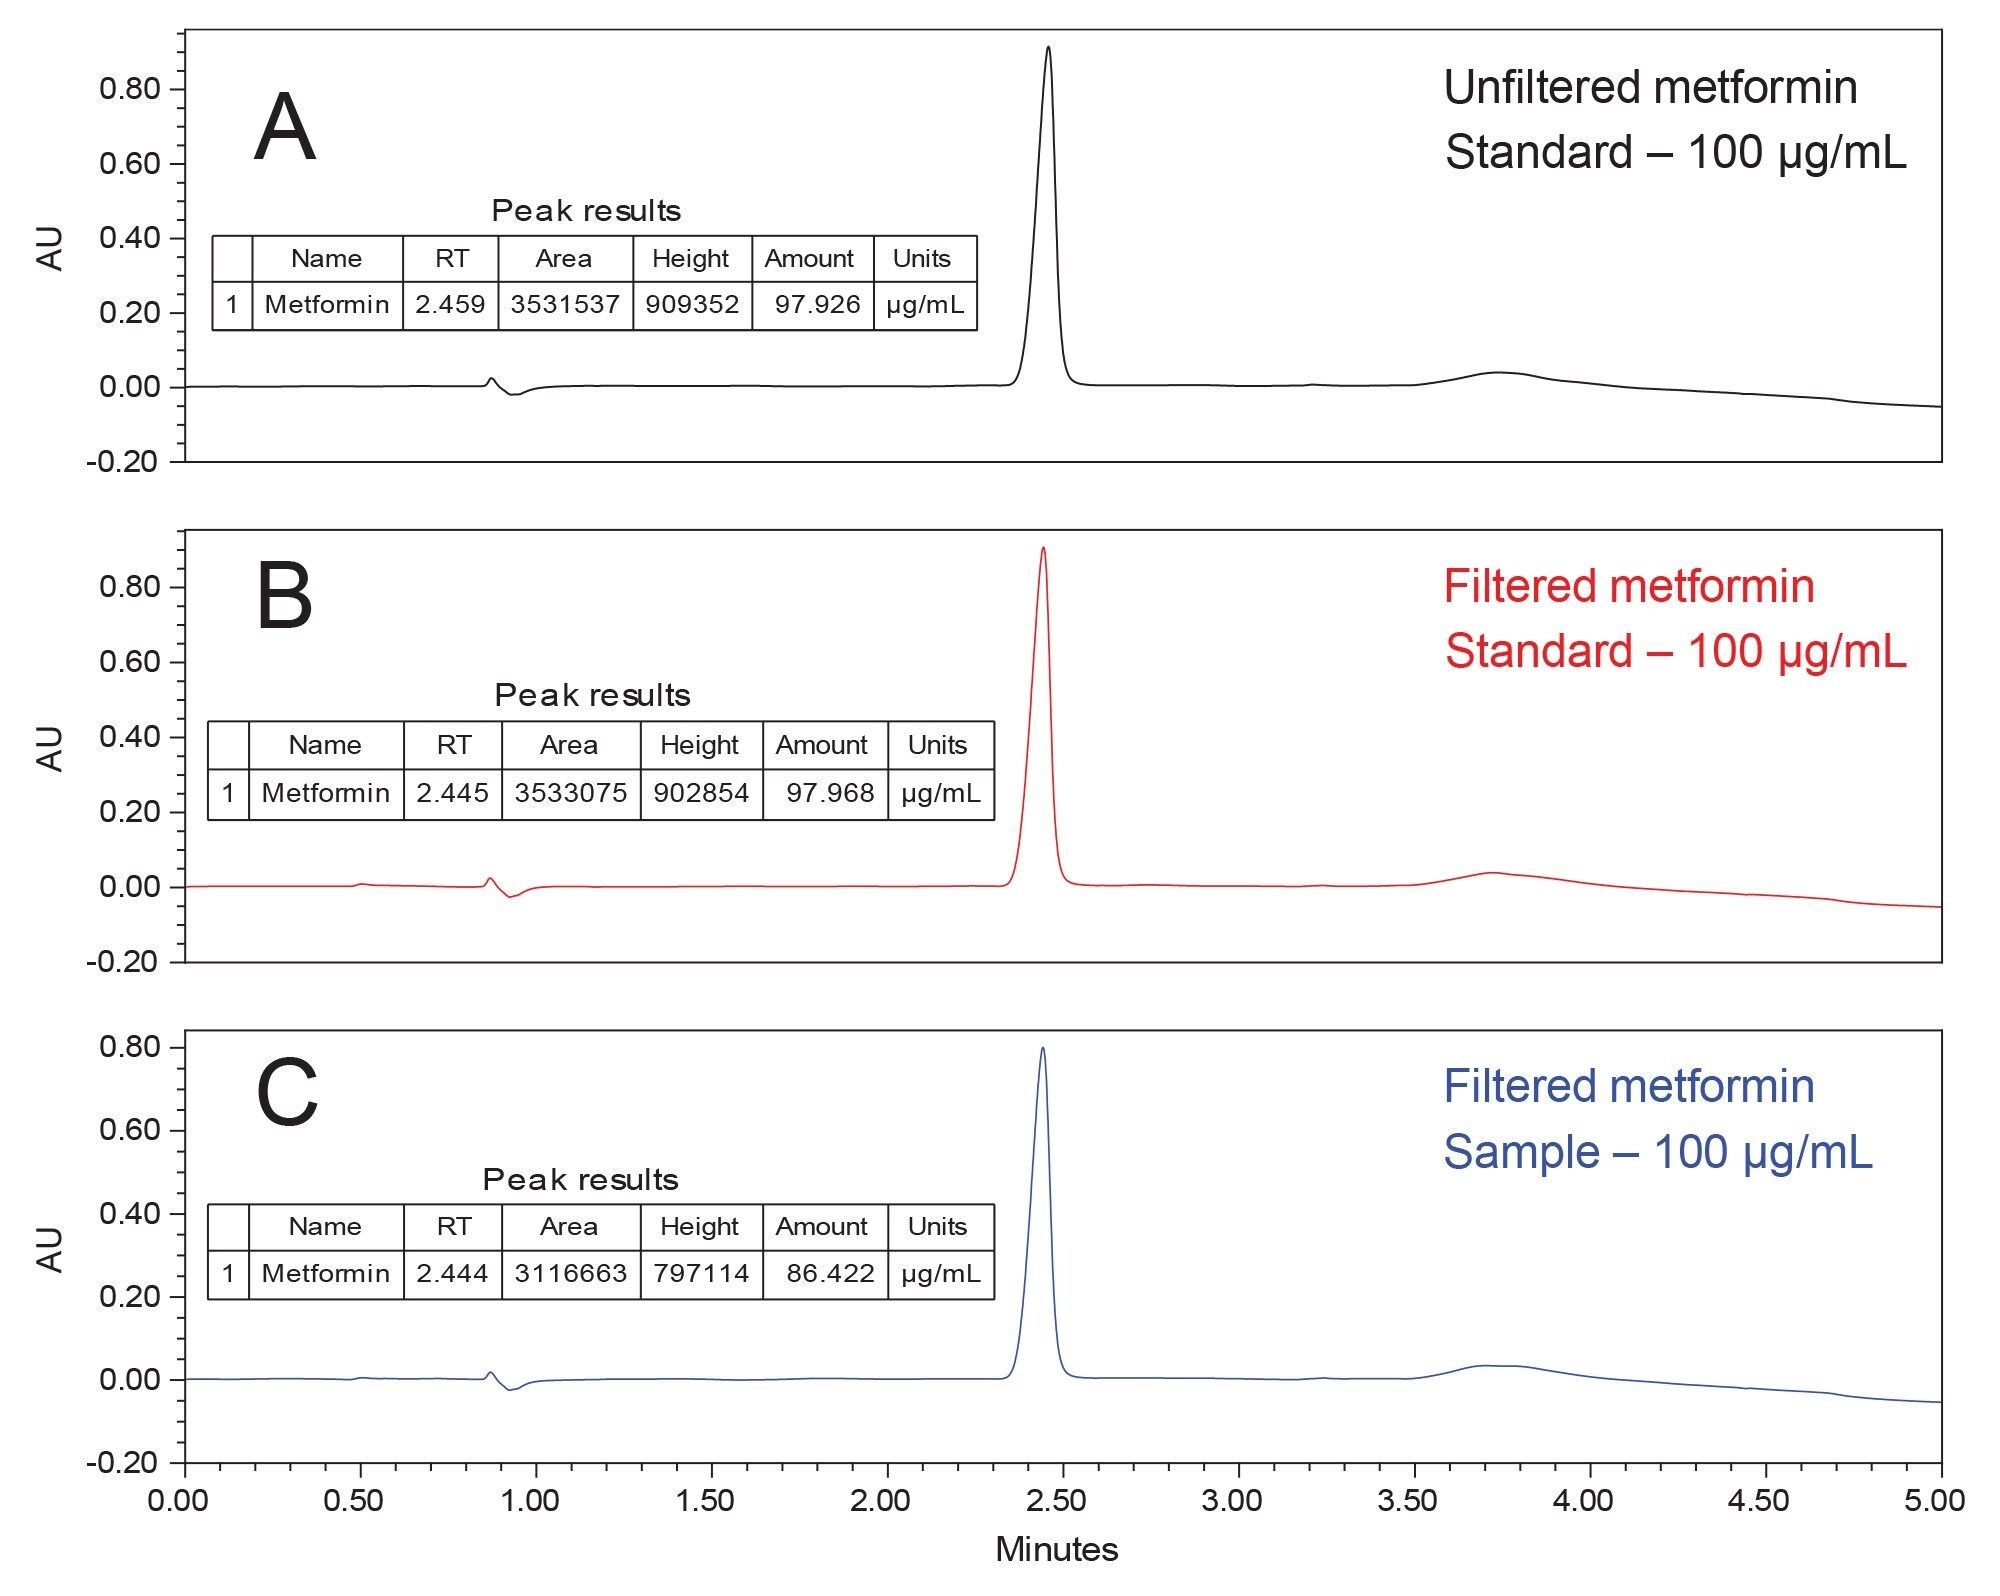 Figure 4A. Chromatogram of the Unfiltered 100 µg/mL Metformin standard quantitated at 97.9 µg/mL.
Figure 4B. Chromatogram of the Filtered 100 µg/mL Metformin standard quantitated at 97.9 µg/mL. This provides confidence that the Metformin is not being lost in the nylon syringe filter.
Figure 4C. Chromatogram of the Metformin drug sample was prepared at a 100 µg/mL concentration. The Metformin peak does not have any interferences and is quantitated at 86.42 µg/mL. Note, sample preparation was not optimized in this method.
Further, the known impurities were spiked into the sample at approximately a 10 µg/mL concentration (Figure 5).
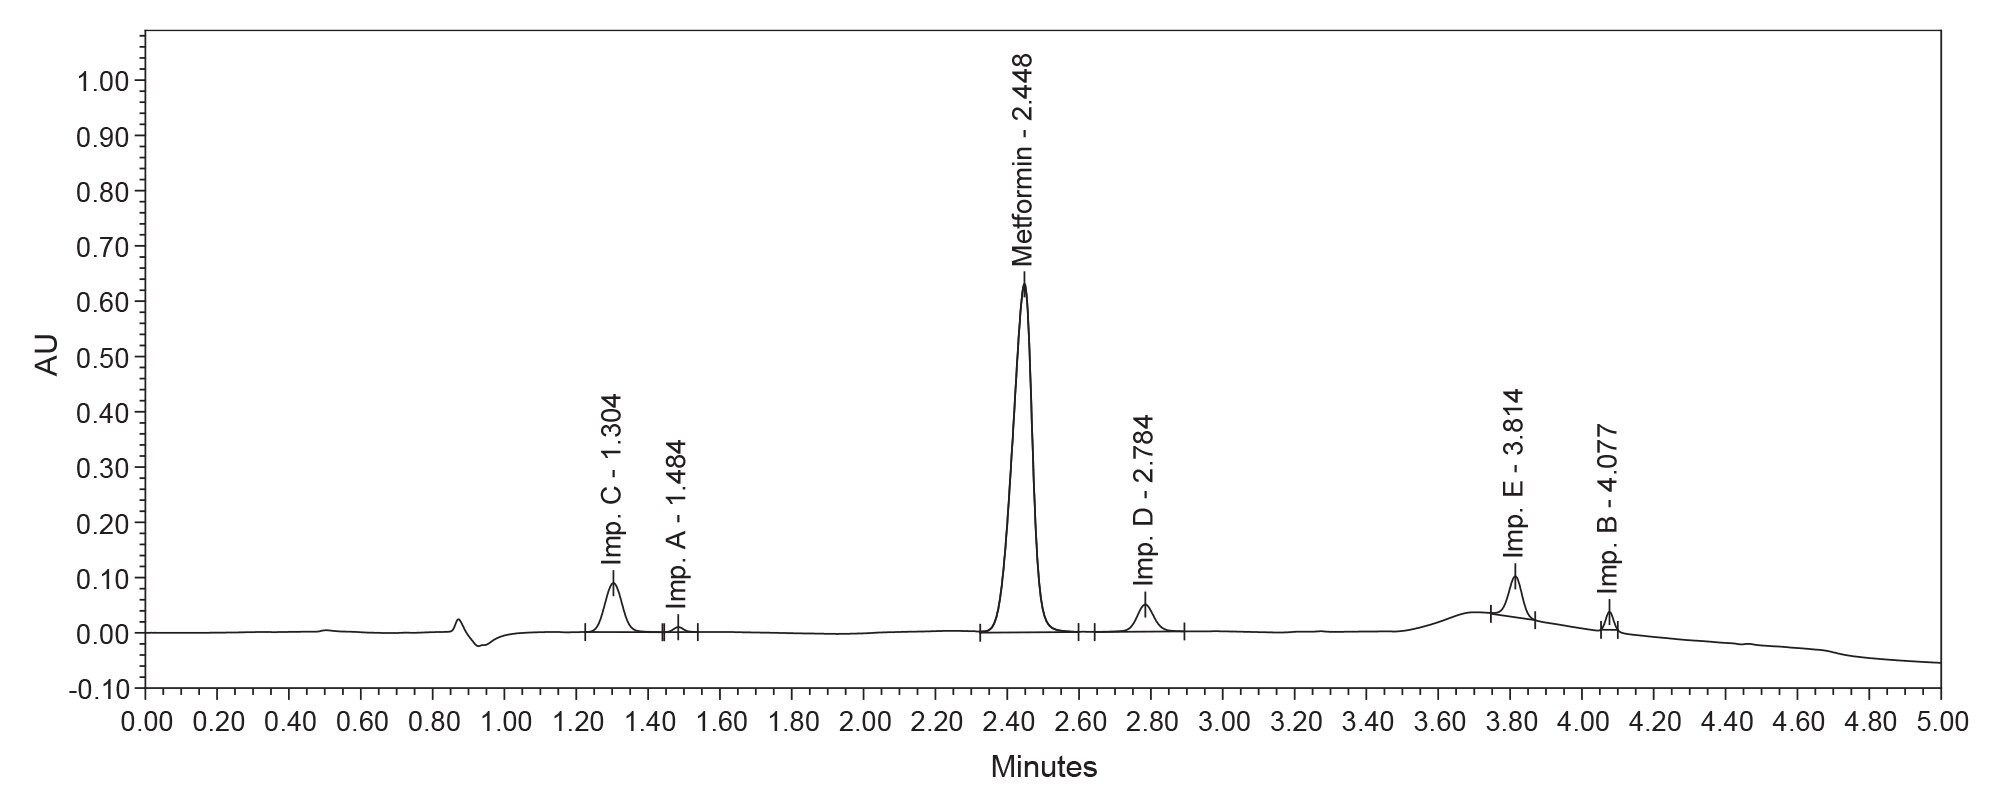 Figure 5. Chromatogram of the Metformin drug sample (100 µg/mL) spiked with the known impurities at a 10 µg/mL concentration. Metformin was successfully separated from the spiked impurities in drug samples.
This method provided a solution for Metformin quantitation, while simultaneously giving visibility to any impurities in the drug samples.
Column Reproducibility
In addition to creating this method, we further tested the lot reproducibility of the new Waters Atlantis Premier BEH Z-HILIC Column stationary phase. Each column was equilibrated for one hour using the starting conditions presented earlier. Then, the Metformin and Impurities standard were run on each column (injections n=3). The area counts and retentions times for the second injection are presented below (Tables 4 and 5).
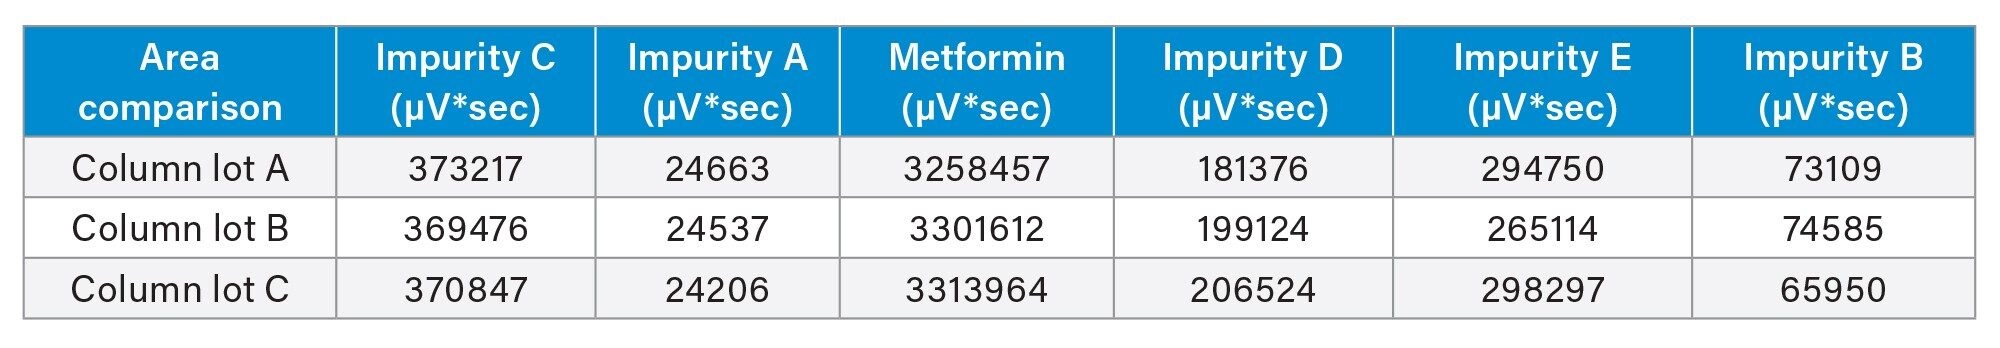 Table 4. A table of the areas for each analyte in the Metformin and Impurities standard across three separate column lots. The data originates from the second injection (injections n=3).
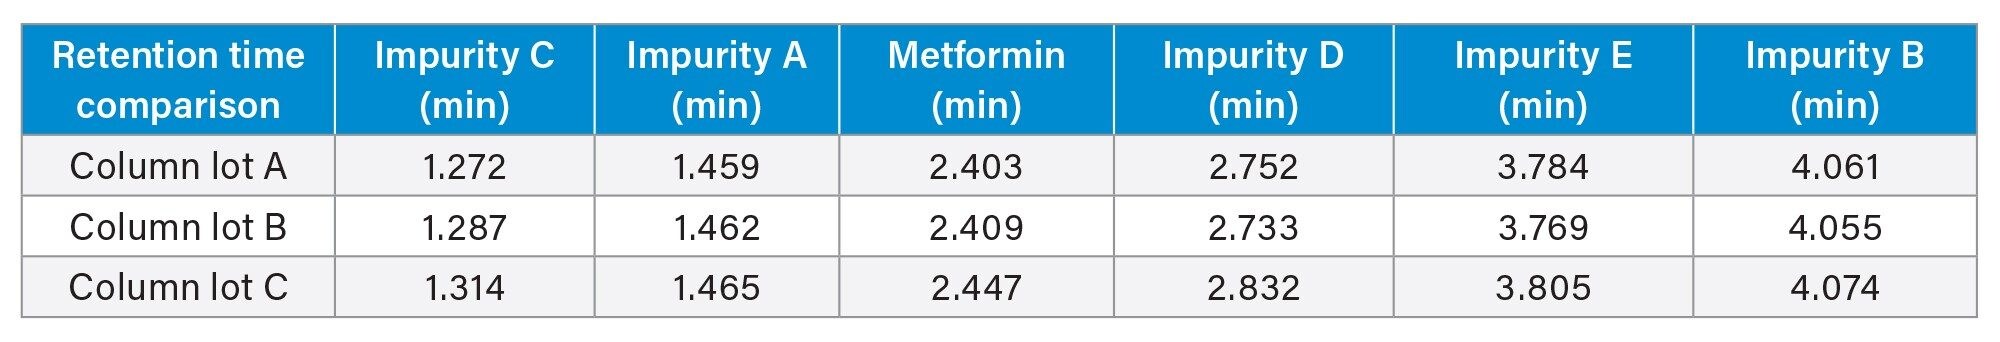 Table 5. A table of the retention times for each analyte in the Metformin and Impurities standard across three separate column lots. The data originates from the second injection (injections n=3).
These results are more clearly represented in the stack chromatogram of each columns performance (Figure 6). The peaks line up across the three different sorbent lots, providing confidence to consumers who use the Waters Atlantis Premier BEH Z-HILIC Column.
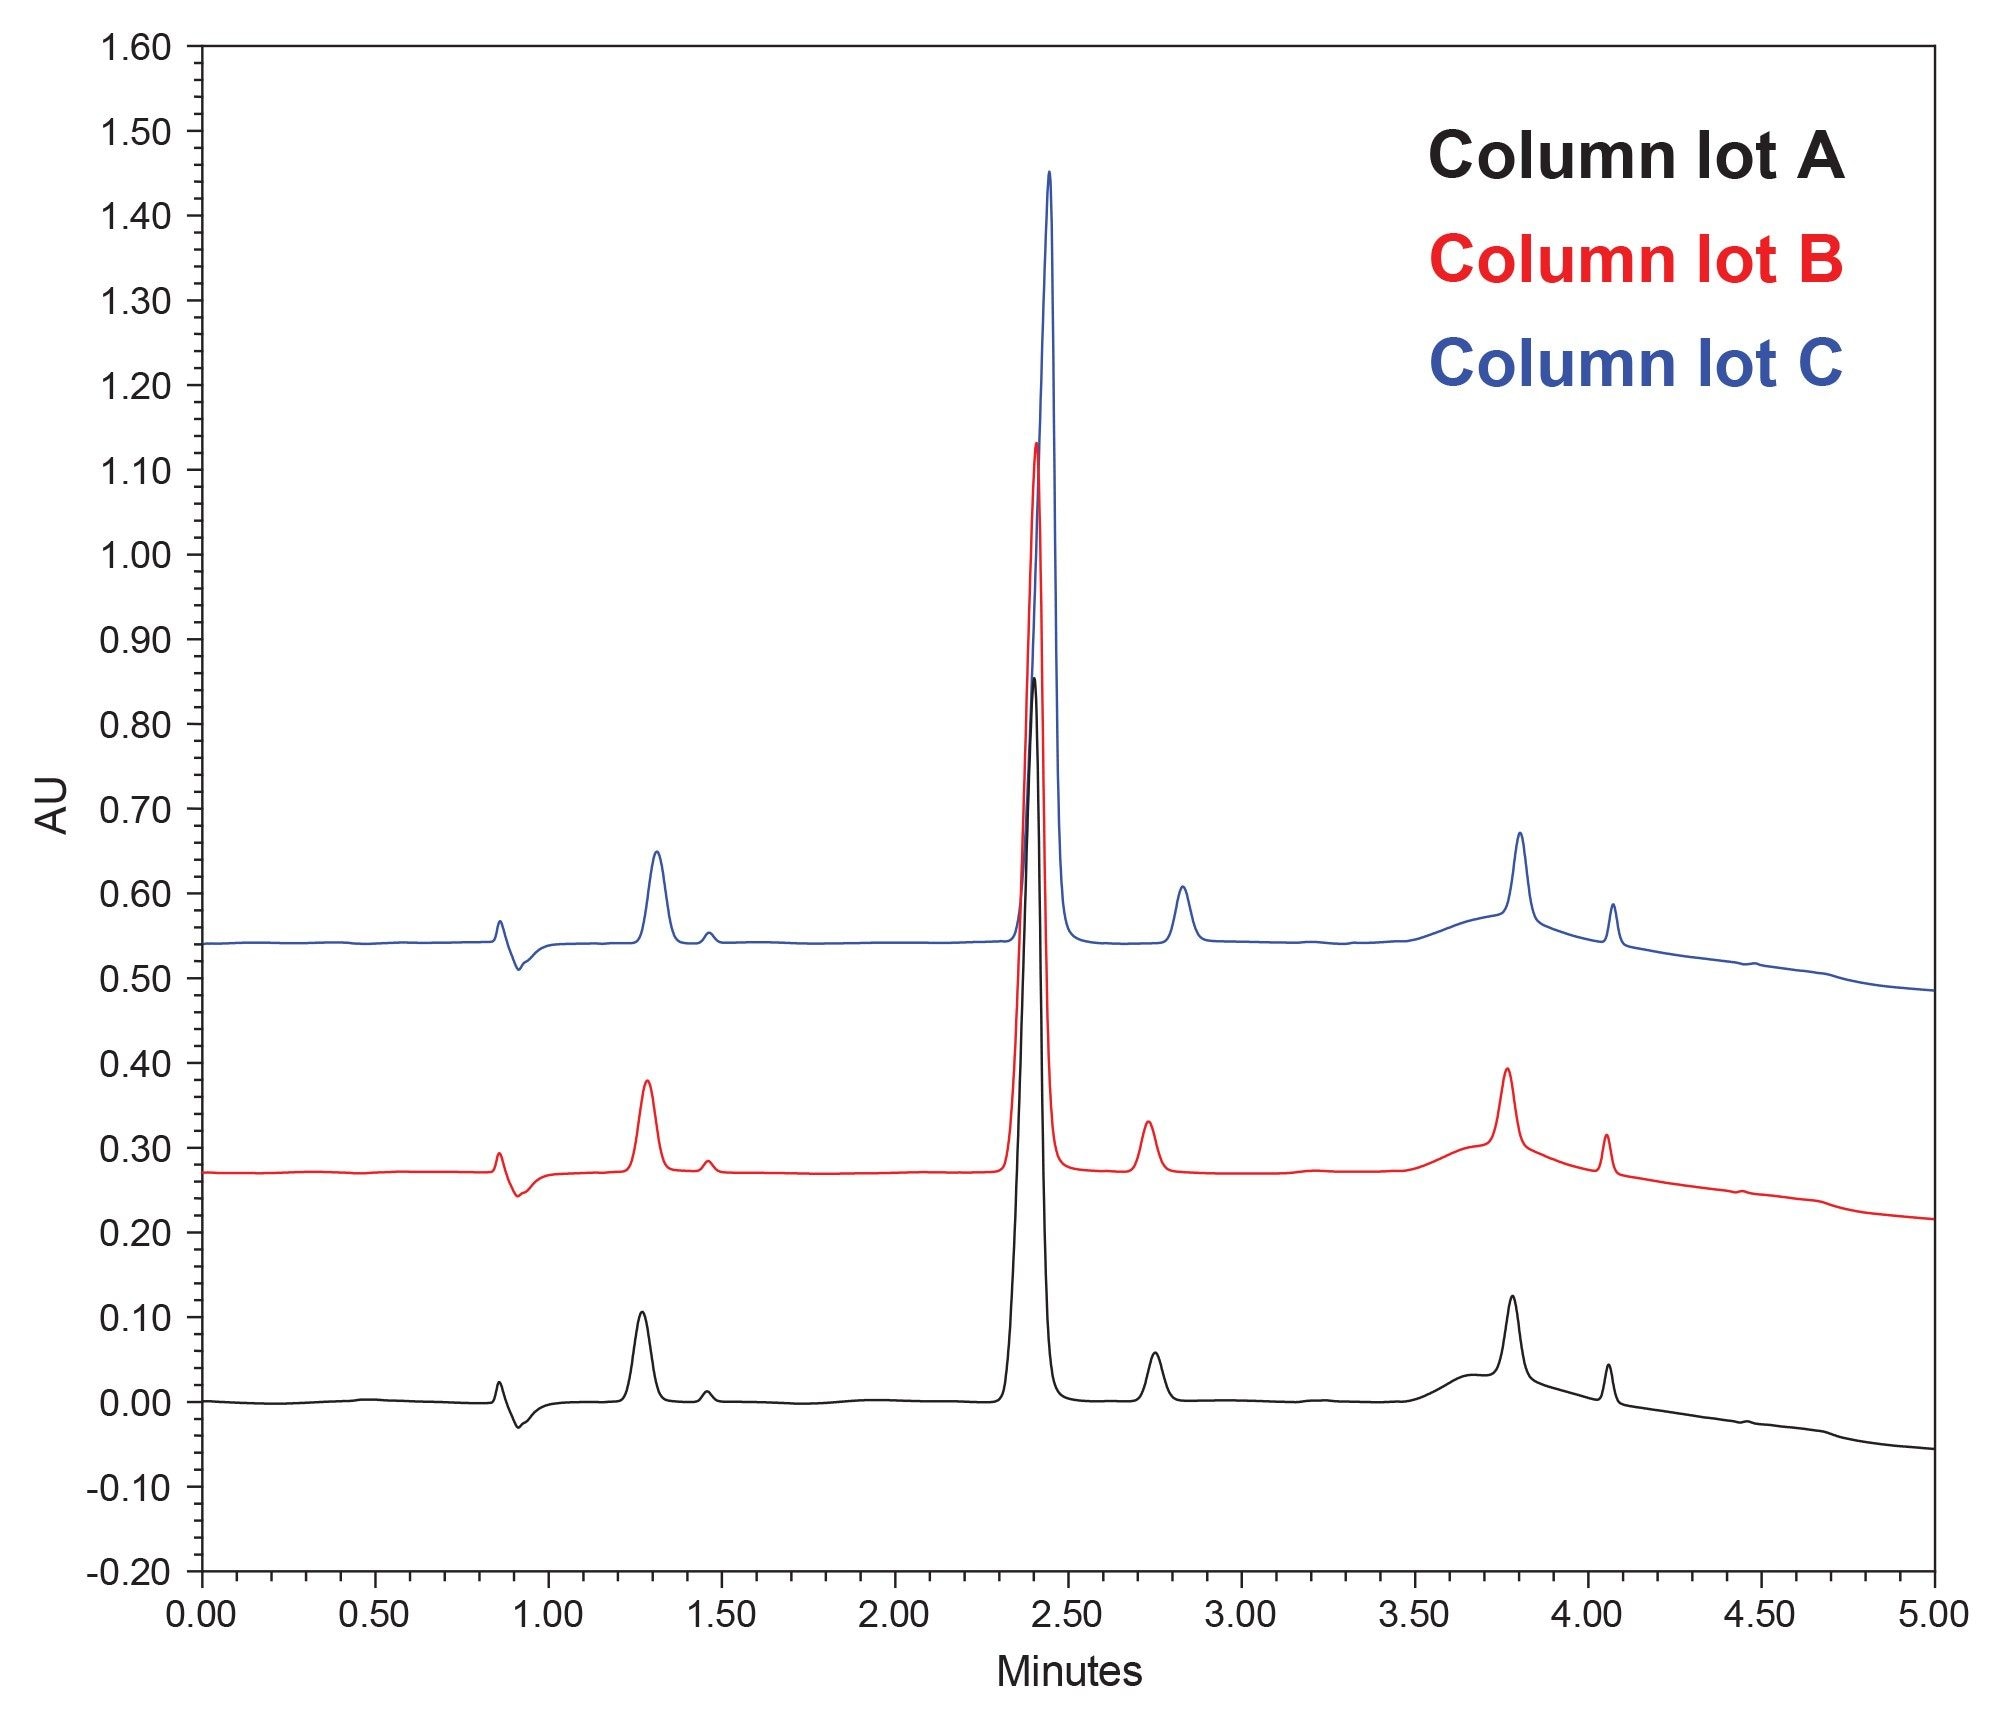 Figure 6. Stack chromatogram of each columns Metformin and Impurities injection; Column Lot A (black), Column Lot B (red), and Column Lot C (blue).
Conclusion
In this study, the use of Waters Atlantis Premier BEH Z-HILIC Column in combination with MS and UV detection was shown to be successful at separating, retaining, and identifying Metformin and its related substances. The Waters Atlantis Premier BEH Z-HILIC Columns have been shown to be consistent in production. Further, this method can be used to accurately quantify Metformin in drug substances. Here, we have provided a method that can be used to assist the quality control of Metformin drug substances in the pharmaceutical industry.
References
- Centers for Disease Control and Prevention. What is Diabetes?. Centers for Disease Control and Prevention. 2021 [cited 2022 Apr 28]. Available from: https://www.cdc.gov/diabetes/basics/diabetes.html.
- Metformin. The Johns Hopkins Patient Guide to Diabetes. John Hopkins Medicine; 2016 [cited 2022 Apr 28]. Available from: https://hopkinsdiabetesinfo.org/medications-for-type-2-diabetes-metformin/.
- Walter T, Berthelette K, Patel A, Alden B, McLaughlin J, Field J, Lawrence N, Shiner S.I ntroducing Atlantis BEH Z-HILIC: A Zwitterionic Stationary Phase Based on Hybrid Organic/Inorganic Particles, Waters Application Note, 2021, 720007311.
- Clements B, Maziarz M, Rainville P. Method for the Analysis and Quantitation of Pharmaceutical Counterions Utilizing Hydrophilic Interaction Liquid Chromatography. Waters Application Note, 2022, 720007564.
- Bethesda (MD): National Library of Medicine (US), National Center for Biotechnology Information; PubChem. PubChem Compound Summary for CID 10005, Cyanoguanidine; [cited 2022 Apr. 25].2004. Available from: https://pubchem.ncbi.nlm.nih.gov/compound/cyanoguanidine#:~:text=Molecular%20Weight-,84.08,-Dates.
- Bethesda (MD): National Library of Medicine (US), National Center for Biotechnology Information; PubChem. PubChem Compound Summary for CID 24196656; [cited 2022 Apr. 25]. 2004. Available from: https://pubchem.ncbi.nlm.nih.gov/compound/24196656#:~:text=Reference-,Molecular%20Weight,204.62,-Computed%20by%20PubChem.
- Bethesda (MD): National Library of Medicine (US), National Center for Biotechnology Information; PubChem. PubChem Compound Summary for CID 11469186, 1,3,5-Triazine-2,4,6-triamine, N,N'-dimethyl-; [cited 2022 Apr. 25]. 2004. Available from: https://pubchem.ncbi.nlm.nih.gov/compound/2-N_4-N-dimethyl-1_3_5-triazine-2_4_6-triamine#:~:text=Molecular%20Weight-,154.17,-Computed%20by%20PubChem.
- Bethesda (MD): National Library of Medicine (US), National Center for Biotechnology Information; PubChem. PubChem Compound Summary for CID 7955, Melamine; [cited 2022 Apr. 25].2004. Available from: https://pubchem.ncbi.nlm.nih.gov/compound/melamine#:~:text=Reference-,Molecular%20Weight,126.12,-Computed%20by%20PubChem.
- Bethesda (MD): National Library of Medicine (US), National Center for Biotechnology Information; PubChem. PubChem Compound Summary for CID 15486, 1-Methylbiguanide; [cited 2022 Apr. 25]. 2004. Available from: https://pubchem.ncbi.nlm.nih.gov/compound/1-Methylbiguanide#:~:text=More...-,Molecular%20Weight,115.14,-Dates.
- Bethesda (MD): National Library of Medicine (US), National Center for Biotechnology Information; PubChem. PubChem Compound Summary for CID 10473, Dimethylamine hydrochloride; [cited 2022 Apr. 25]. 2004. Available from: https://pubchem.ncbi.nlm.nih.gov/compound/Dimethylamine-hydrochloride#:~:text=4.2Mass%20Spectrometry.
720007633, May 2022