Reversed-Phase Column Performance for Peptide and Peptide Mapping Separations
Abstract
The performance of eight of Waters™ reversed-phase columns for peptide separations containing 2 to 3 µm particles were compared using well documented peptide standards. Differences in selectivity and peak capacity are observed between different column chemistries were observed using a gradient of increasing organic solvent concentration that contained formic acid (FA) mobile phase additive. The selectivity is equivalent between use of MaxPeak™ Premier High Performance Surfaces (HPS) columns and unmodified stainless-steel columns containing the same reversed-phase column particles. Extracted Ion Chromatograms (XIC) show different selectivity among different MaxPeak Premier Columns, where the spectra are cleaner for the deamidated form when it is better separated from the unmodified form.
Benefits
Waters reversed-phase columns are able to provide effective performance in peptide separation.
Introduction
Reversed-phase chromatography is one of the most used tools to separate peptides of similar composition. Based on a recent United States Pharmacopeia (USP) survey, more than 500 different C18 (i.e., USP “L1” classification) exists. In 2017, the performance of ten of Waters reversed-phase columns were compared side by side and features of each column chemistry were summarized regarding peptide mapping separations.1
MaxPeak Premier reversed-phase columns are equipped with MaxPeak High Performance Surfaces (HPS) hardware that is designed to minimize undesired analyte/column hardware surface interactions.2 In this application note, the performance of eight Waters reversed-phase columns (both MaxPeak Premier and unmodified stainless-steel columns) is compared, and differences in selectivity, peak capacity, and peak shape are noted.
Experimental
LC Conditions
|
LC system: |
ACQUITY™ UPLC™ I-Class PLUS |
|
Detection: |
TUV @ 214 nm, ACQUITY BioAccord MS detection |
|
Column(s): |
XSelect™ Premier Peptide CSH™ C18 130 Å, 2.5 µm, 2.1 x 150 mm column (p/n: 186009906) XSelect Peptide CSH C18, 2.5 µm, 2.1 x 150 mm (p/n: 186006943) XBridge™ Premier Peptide BEH™ C18 130 Å, 2.5 µm, 2.1 x 150 mm column (p/n: 186009835) XBridge Peptide BEH C18 130 Å, 2.5 µm, 2.1 x 150 mm (p/n: 186008981) XBridge Premier Peptide BEH C18 300 Å, 2.5 µm, 2.1 x 150 mm (p/n: 186009894) XSelect Premier Peptide HSS T3, 2.5 µm, 2.1 x 150 mm (p/n: 186009840) CORTECS™ Premier C18+, 2.7 µm, 2.1 x 150 mm (p/n: 186010457) CORTECS C18+, 2.7 µm, 2.1 x 150 mm (p/n: 186007368) |
|
Column temperature: |
60˚C |
|
Sample temperature: |
10˚C |
|
Injection volume: |
15 µL, 10 µL |
|
Flow rate: |
0.2 mL/min |
|
Mobiles phases: |
A: 0.1 % Formic acid in H2O B: 0.1 % Formic acid in Acetonitrile |
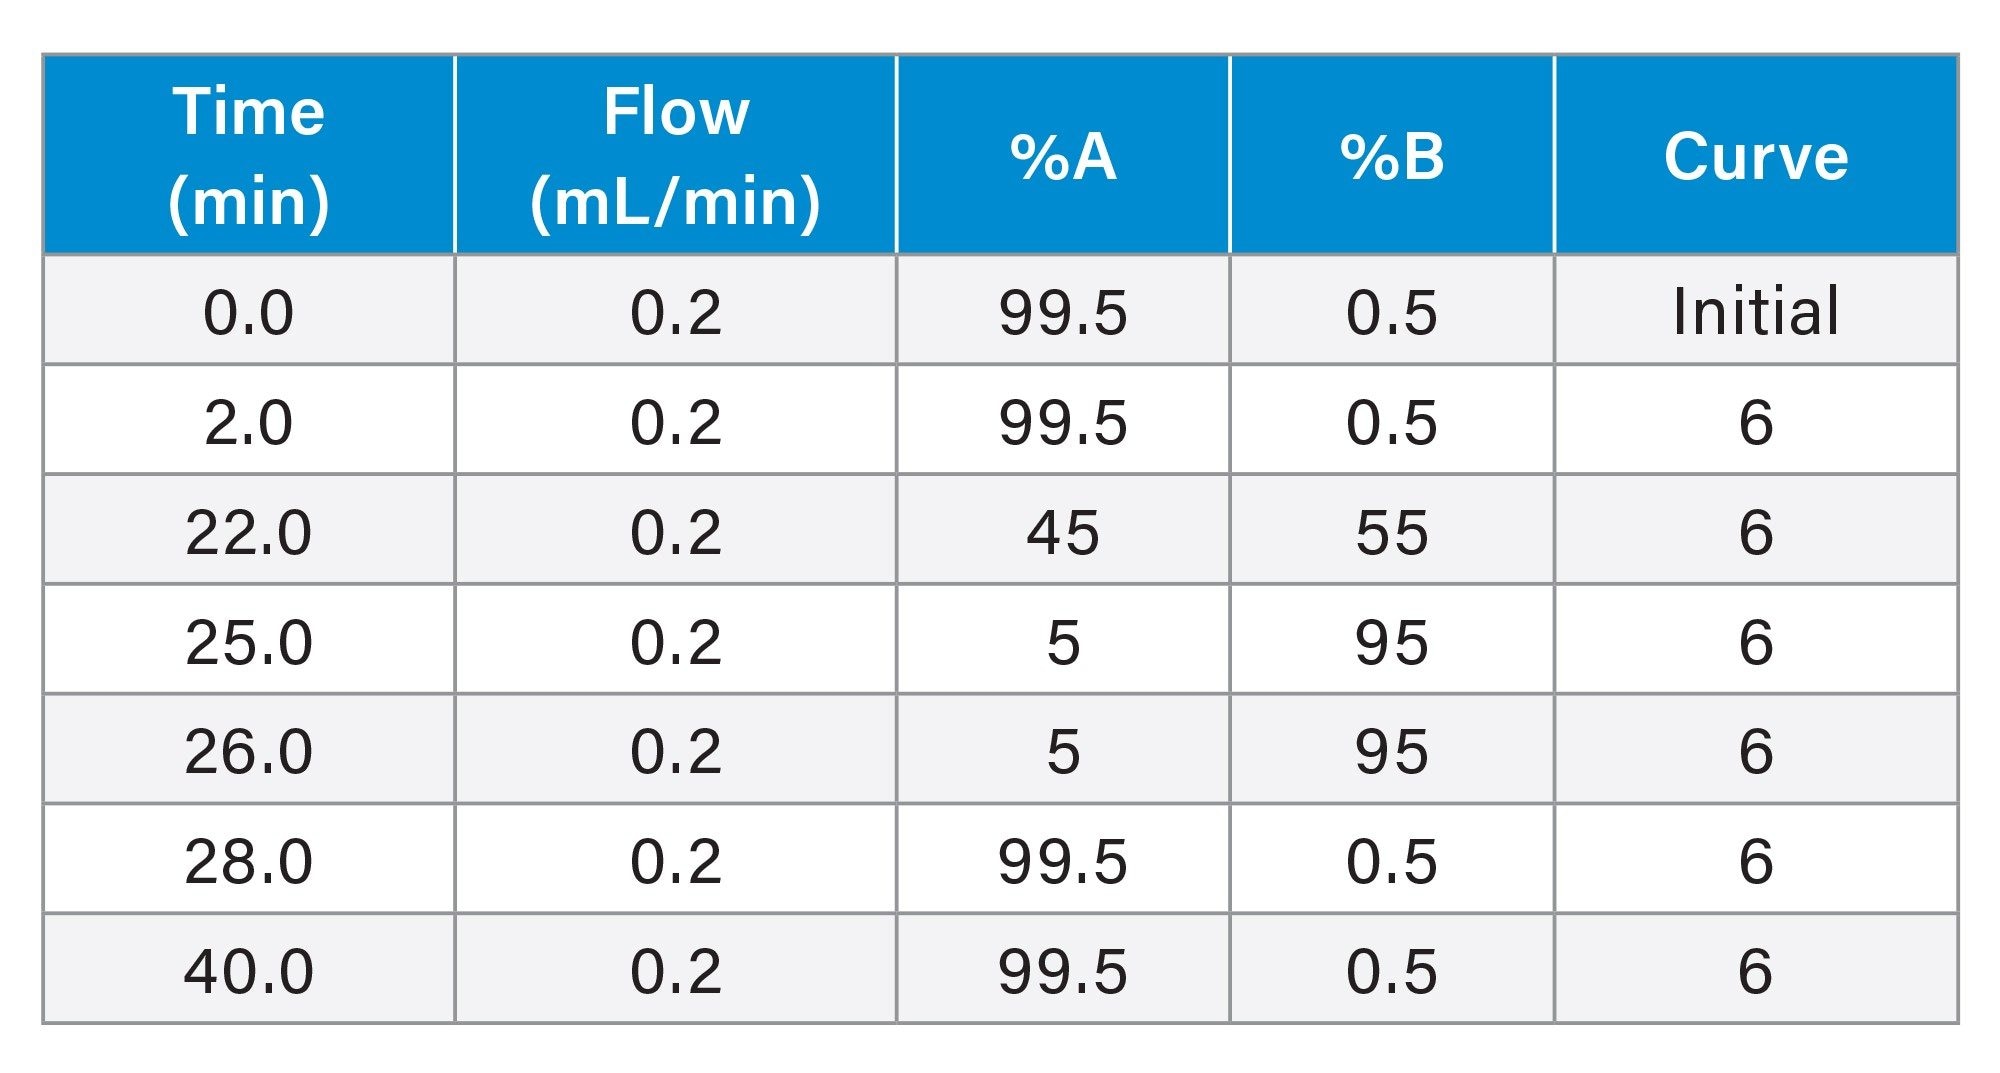
Gradient Table for MassPREP Peptide Mixture
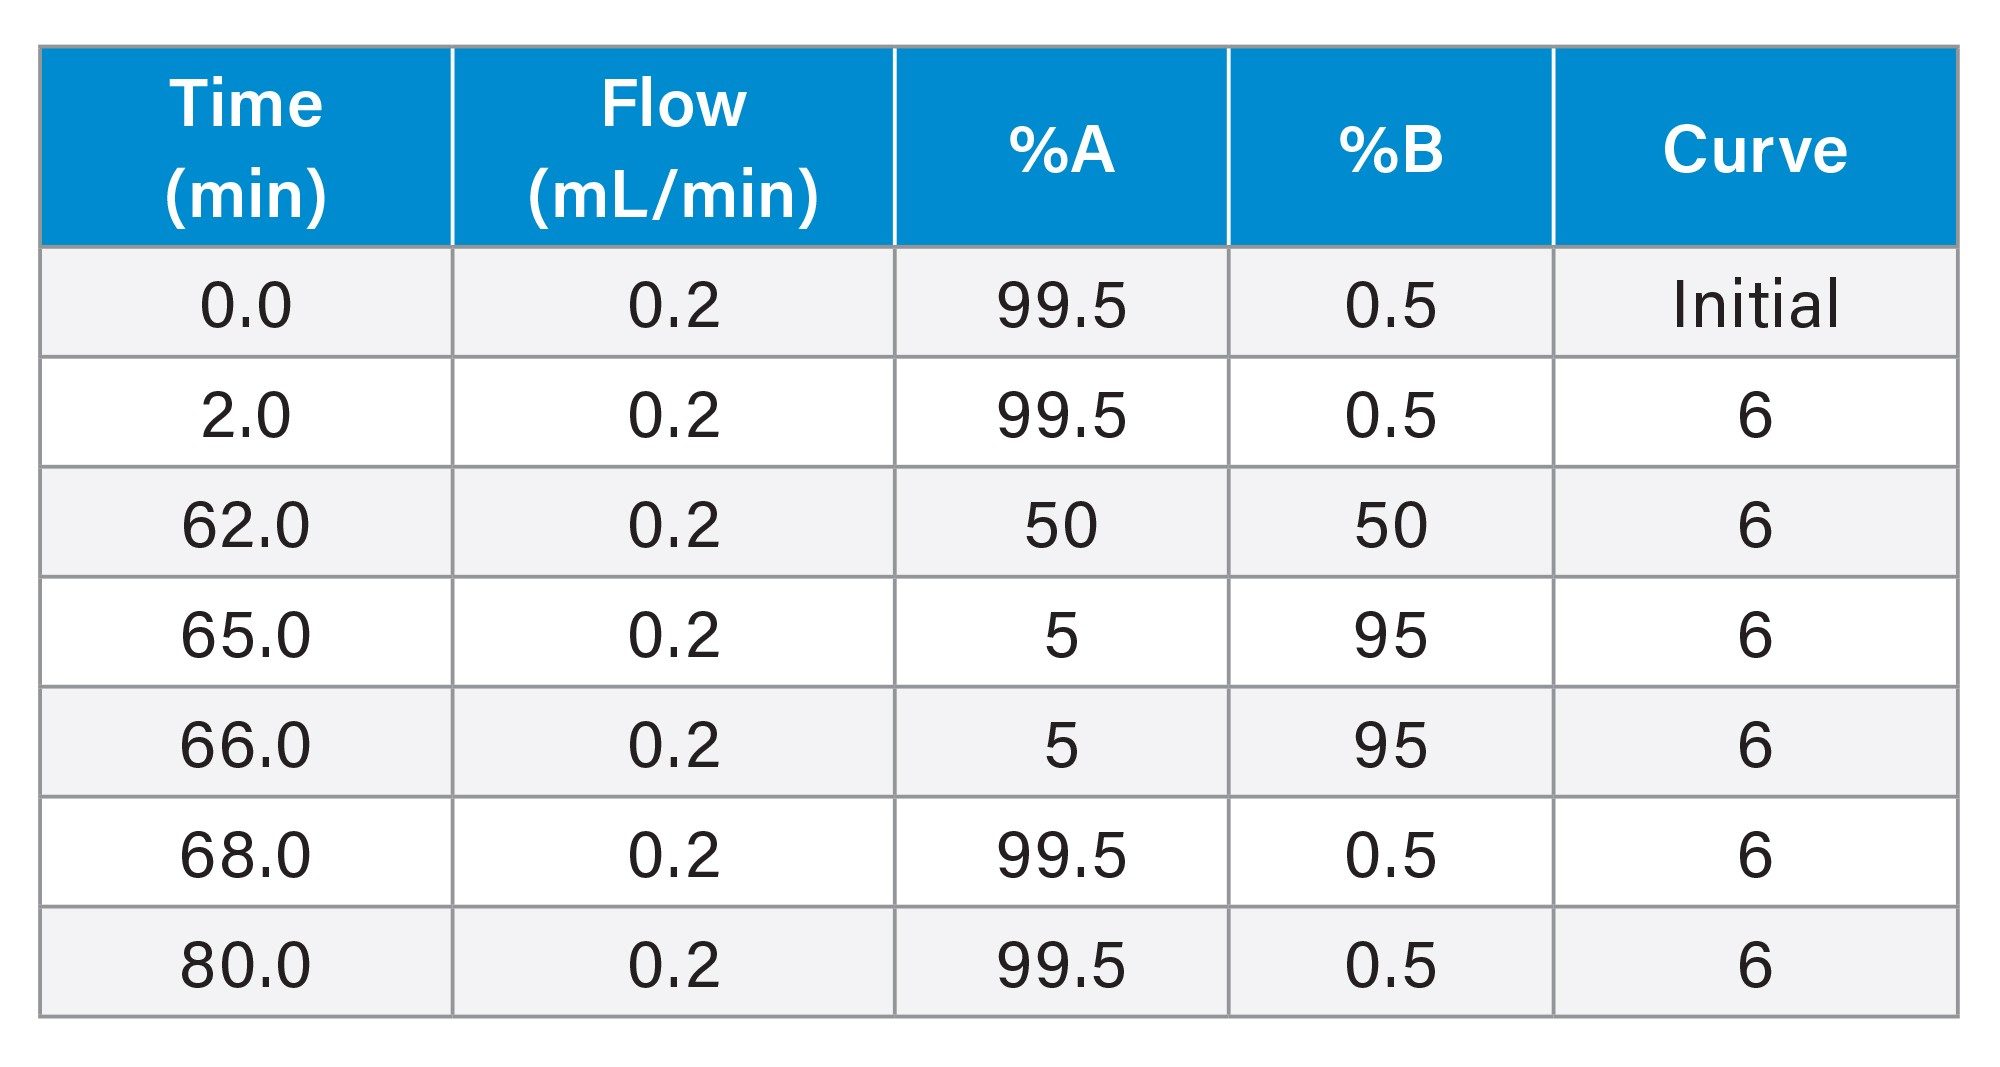
Gradient Table for mAb Tryptic Digestion Standard
ACQUITY RDa Detector Settings
|
Mode: |
Full scan with fragmentation |
|
Mass range: |
50–2000 m/z |
|
Polarity: |
Positive |
|
Sample rate: |
5 Hz |
|
Cone voltage: |
30 V |
|
Fragmentation cone voltage |
60–120 V |
|
Capillary voltage: |
1.20 kV |
|
Desolvation temperature: |
350 °C |
Data Management
|
LC/MS software: |
waters_connect™ |
Results and Discussion
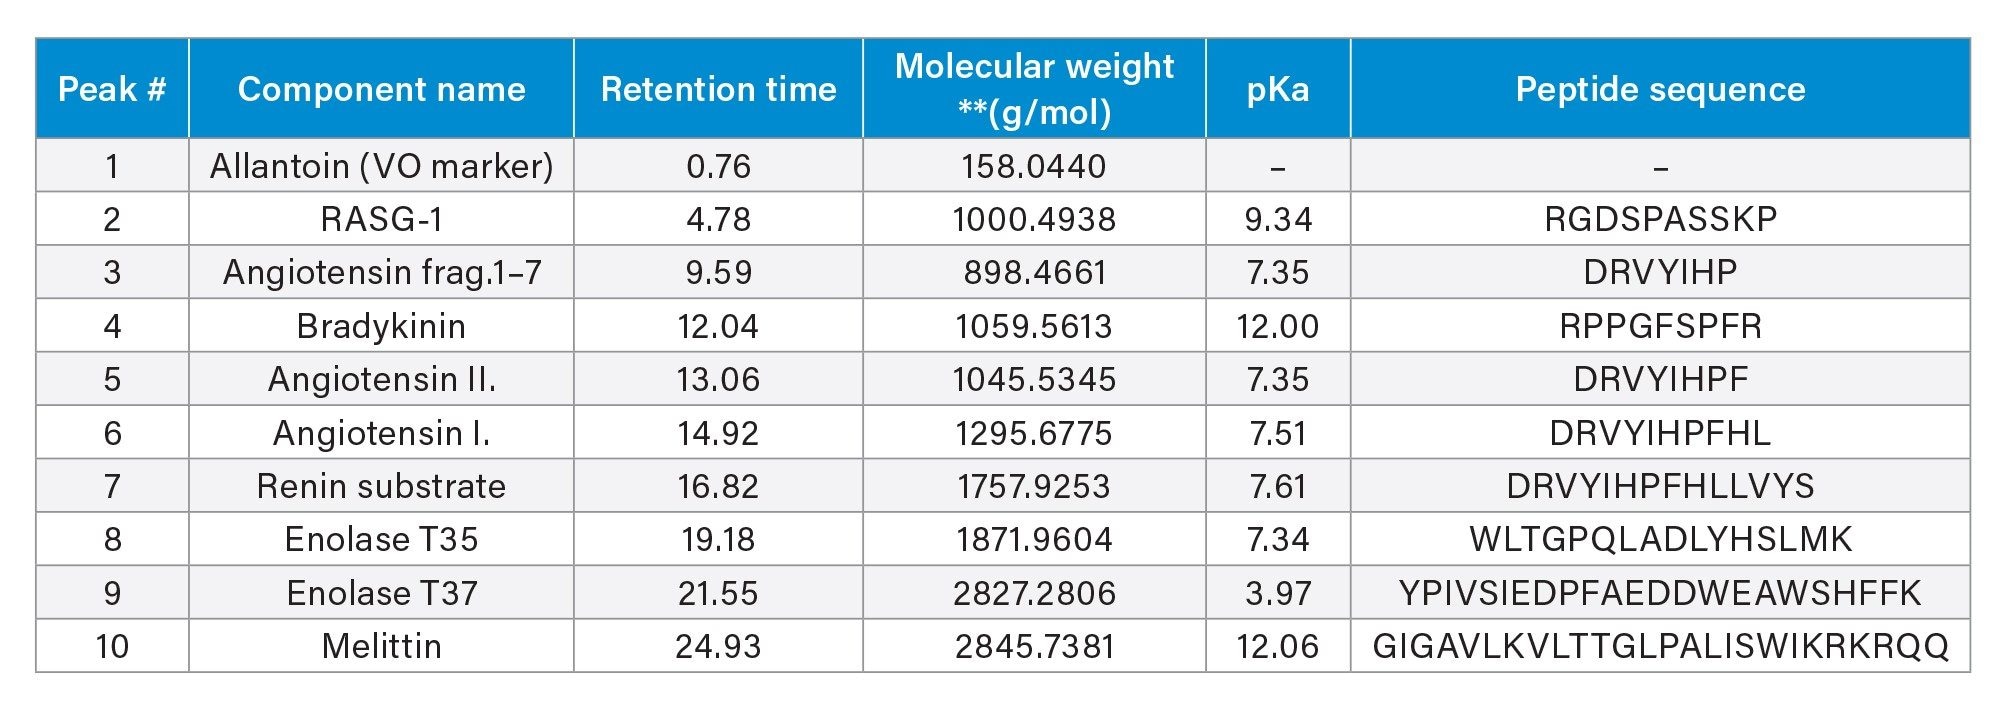
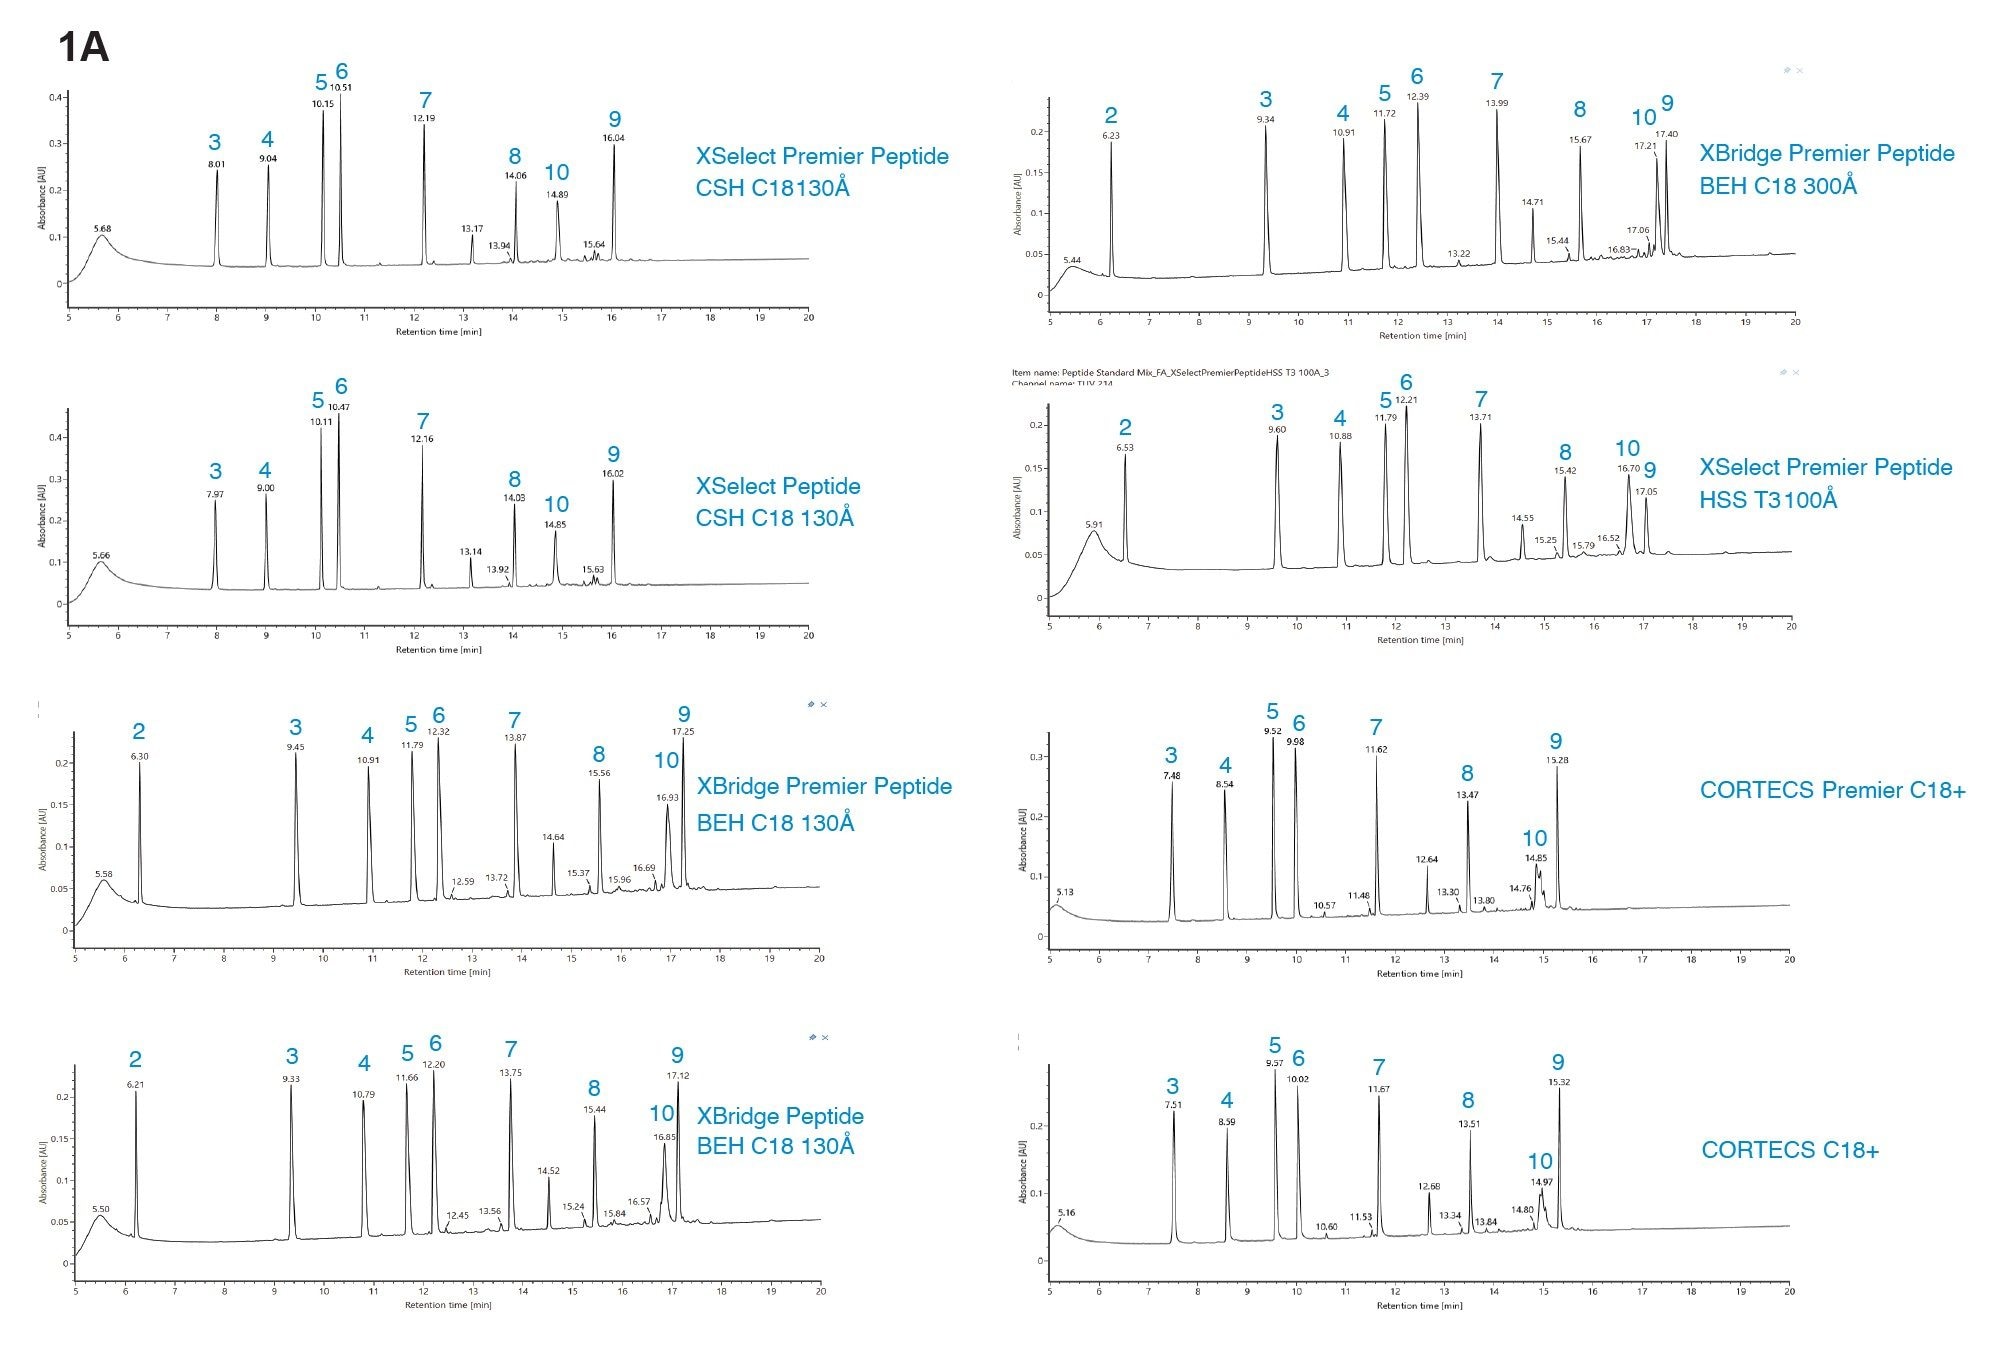
Separations of the well characterized MassPREP Peptide Standard Mixture (Table 1) on eight of Waters reversed-phase columns with different column chemistries showed different selectivity for the peptides evaluated as previously reported.1
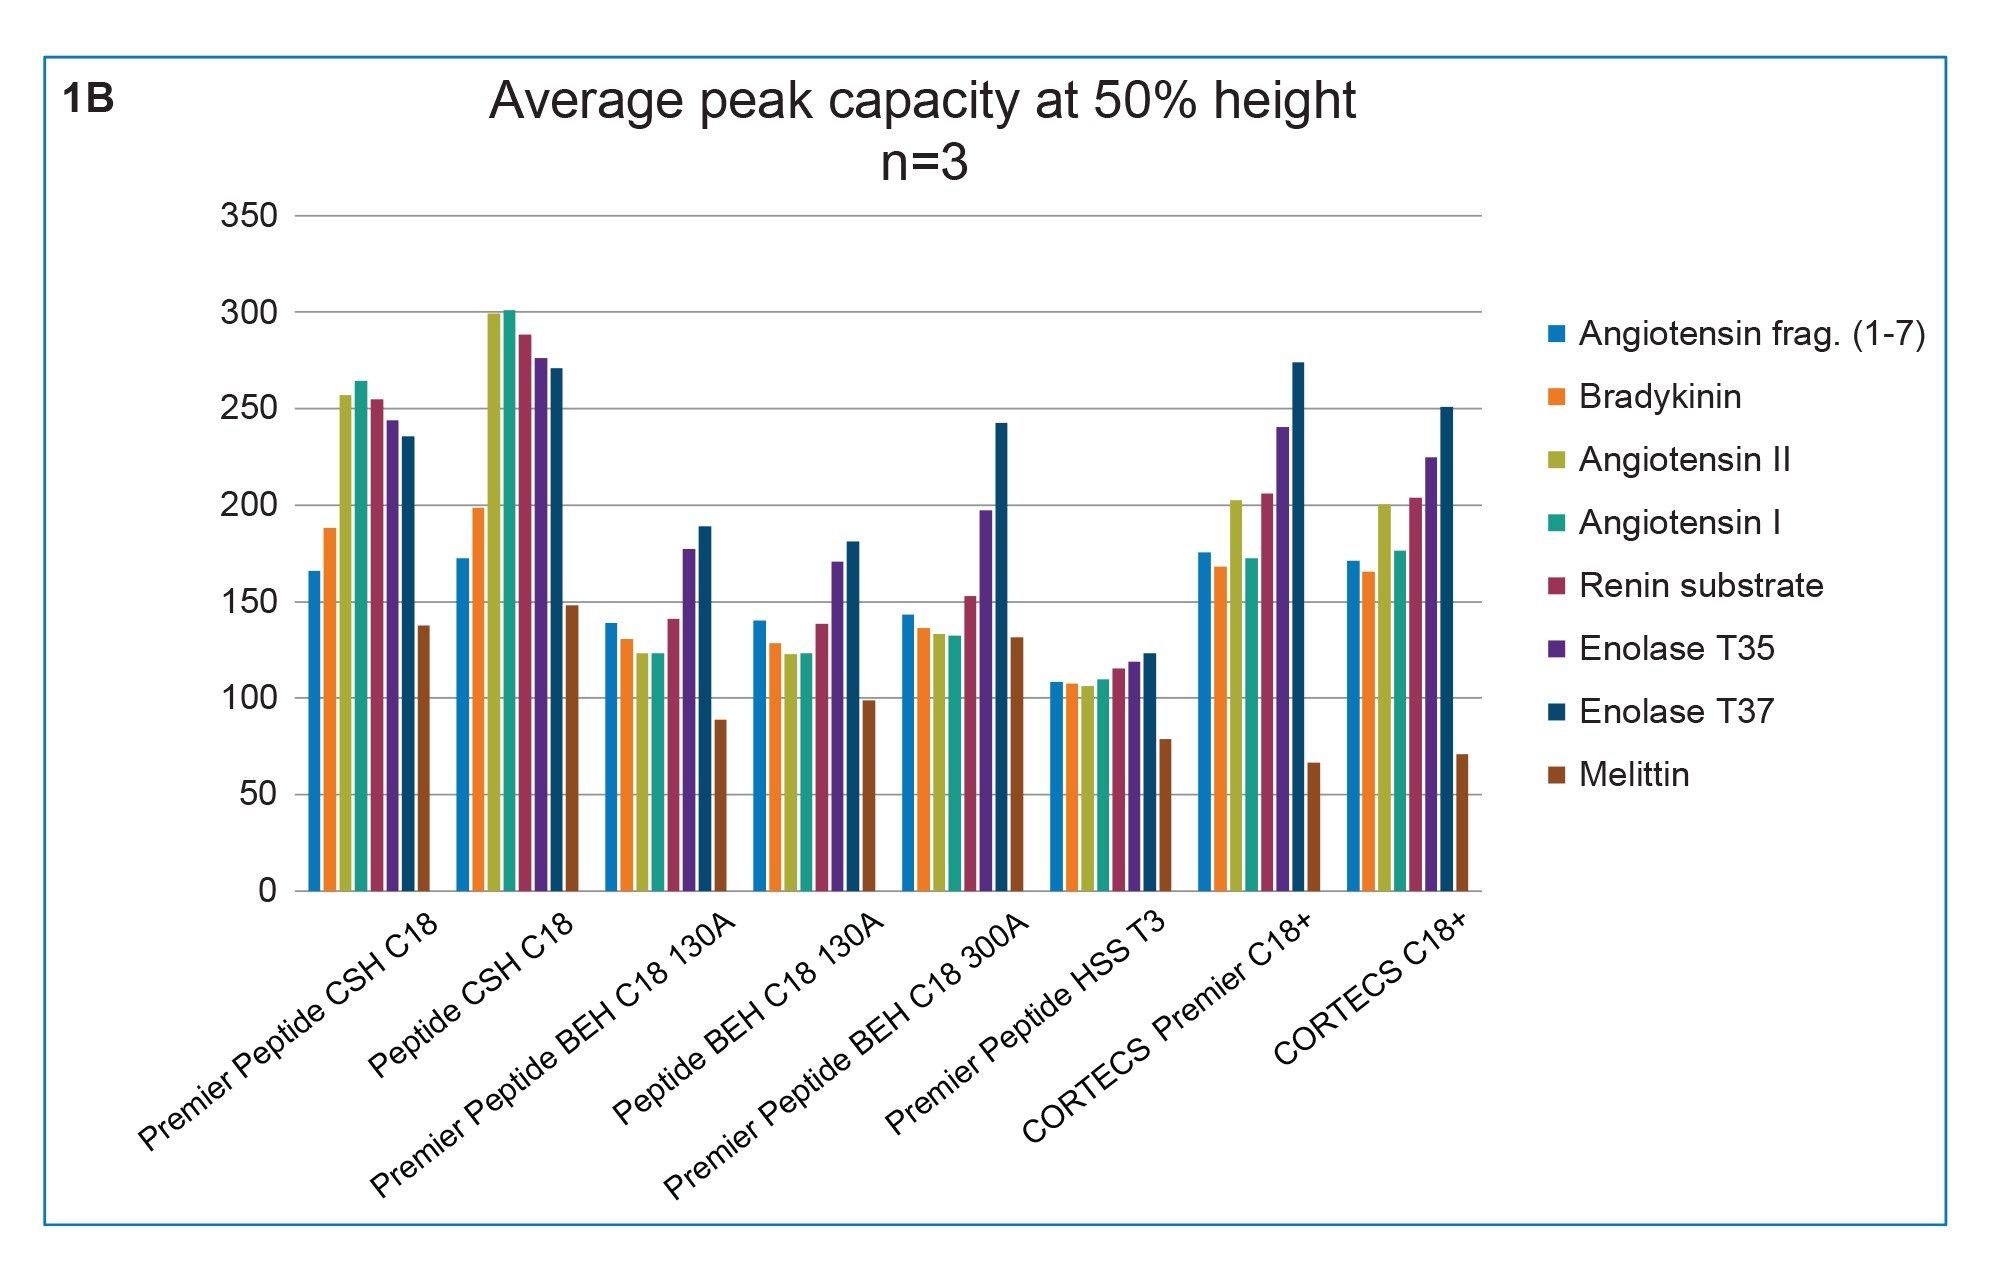
The peptide separation selectivity between the same column particles (i.e. chemistry) contained in MaxPeak Premier Column compared to packed in unmodified stainless-steel columns is highly similar (Figure 1a). Consistent with previous findings, under gradients of increasing organic solvent concentration containing 0.1% FA mobile phase additive, the CSH C18 130 Å columns provided the highest peak capacity, followed by CORTECS C18+ columns (Figure 1b), presumably due to the small amount of positive charge embedded onto the C18 particles.
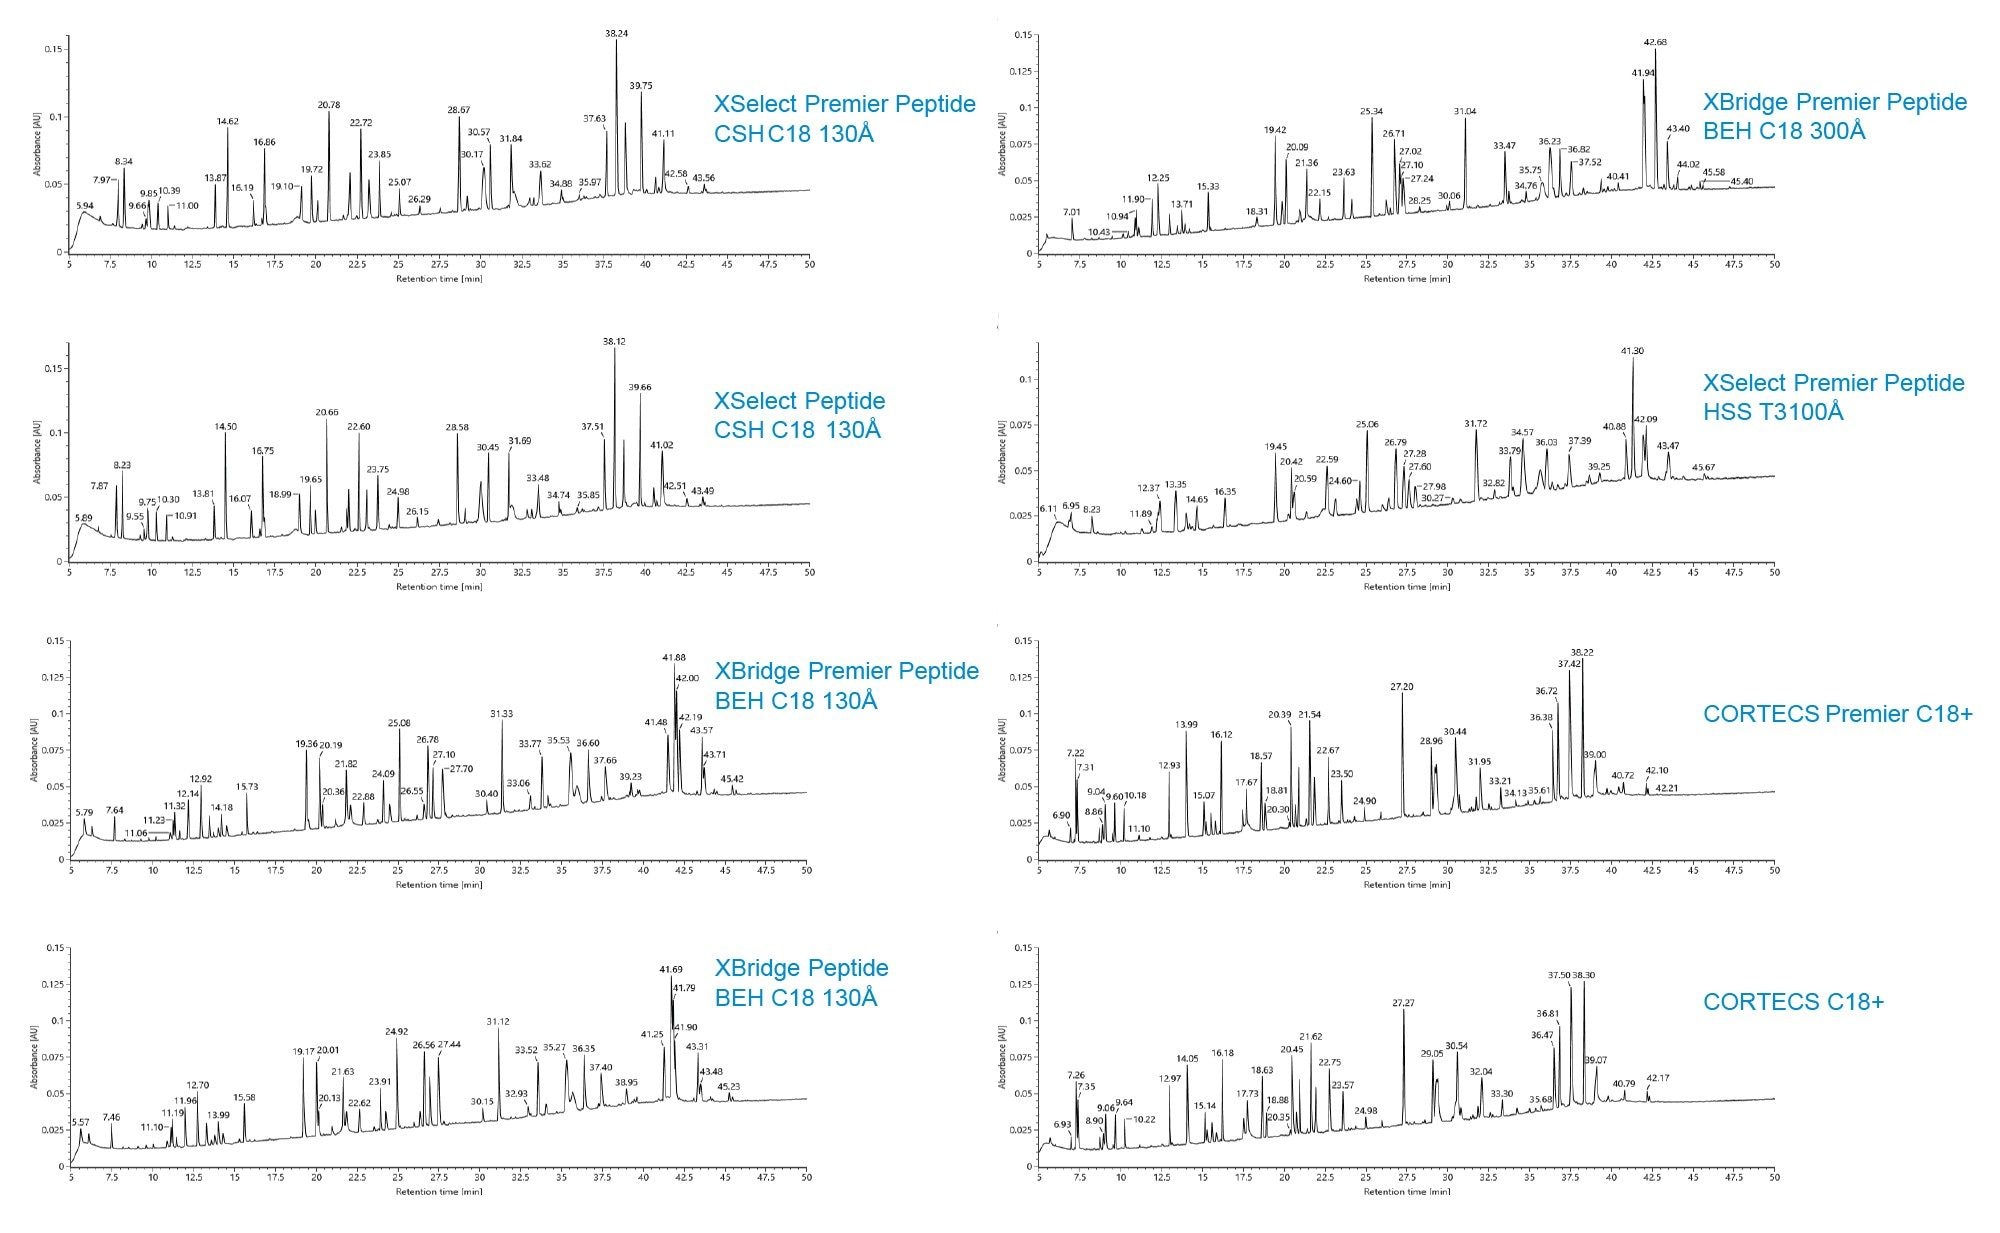
In addition, the retentivity is generally lower for these columns that contain a small degree of positive charges. Similarly, peptide selectivity differences are observed between the eight different Waters column chemistries when the NISTmAb™ tryptic digest is separated (Figure 2).
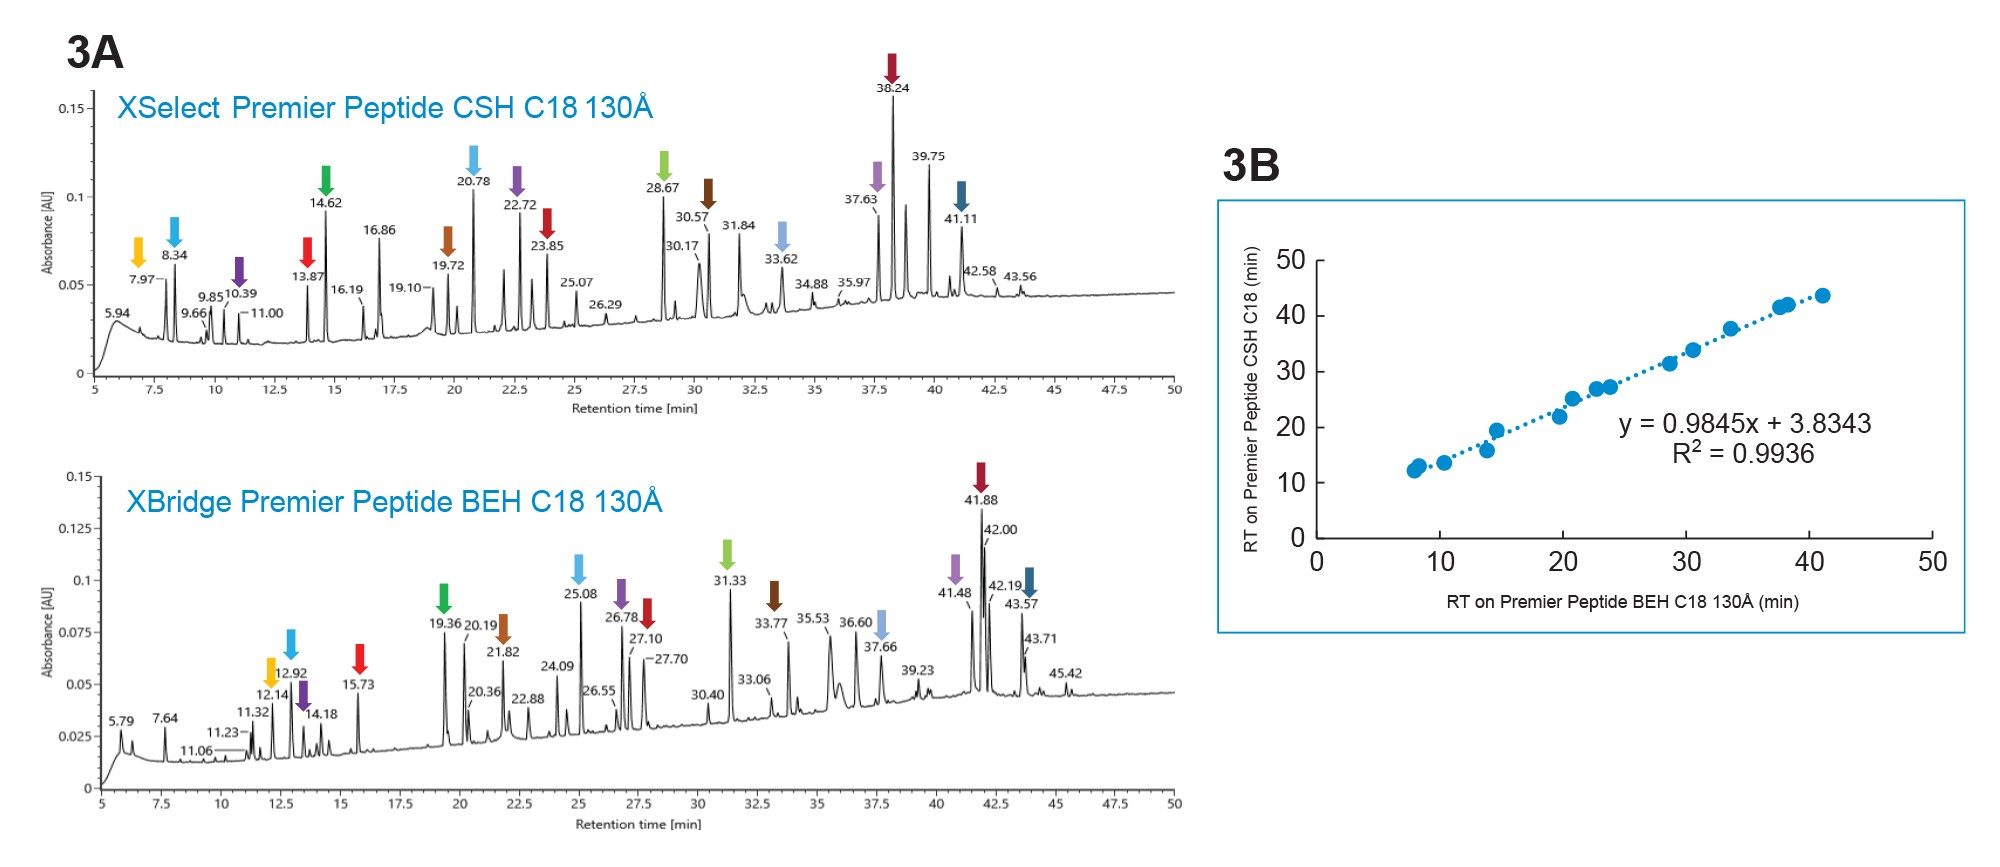
To elaborate the selectivity difference, peaks were identified on the XSelect Premier Peptide CSH C18 Column and the XBridge Premier Peptide BEH C18 130 Å Column using MS data collected on a BioAccord LC-MS System and waters_connect (Figure 3a). The same color arrow represents the same peptide. Note that less overall peptide retentivity is seen on the Premier XSelect CSH C18 130 Å column compared to data collected on the XBridge BEH C18 130 Å Column. In addition, it was observed that the spacing among some of color arrowed identified peptides is different on the two columns (e.g. blue and purple pair and red and green pair), while the overall retention time of the 15 peptides correlate well between these two columns (Figure 3b), indicating somewhat similar column selectivity.
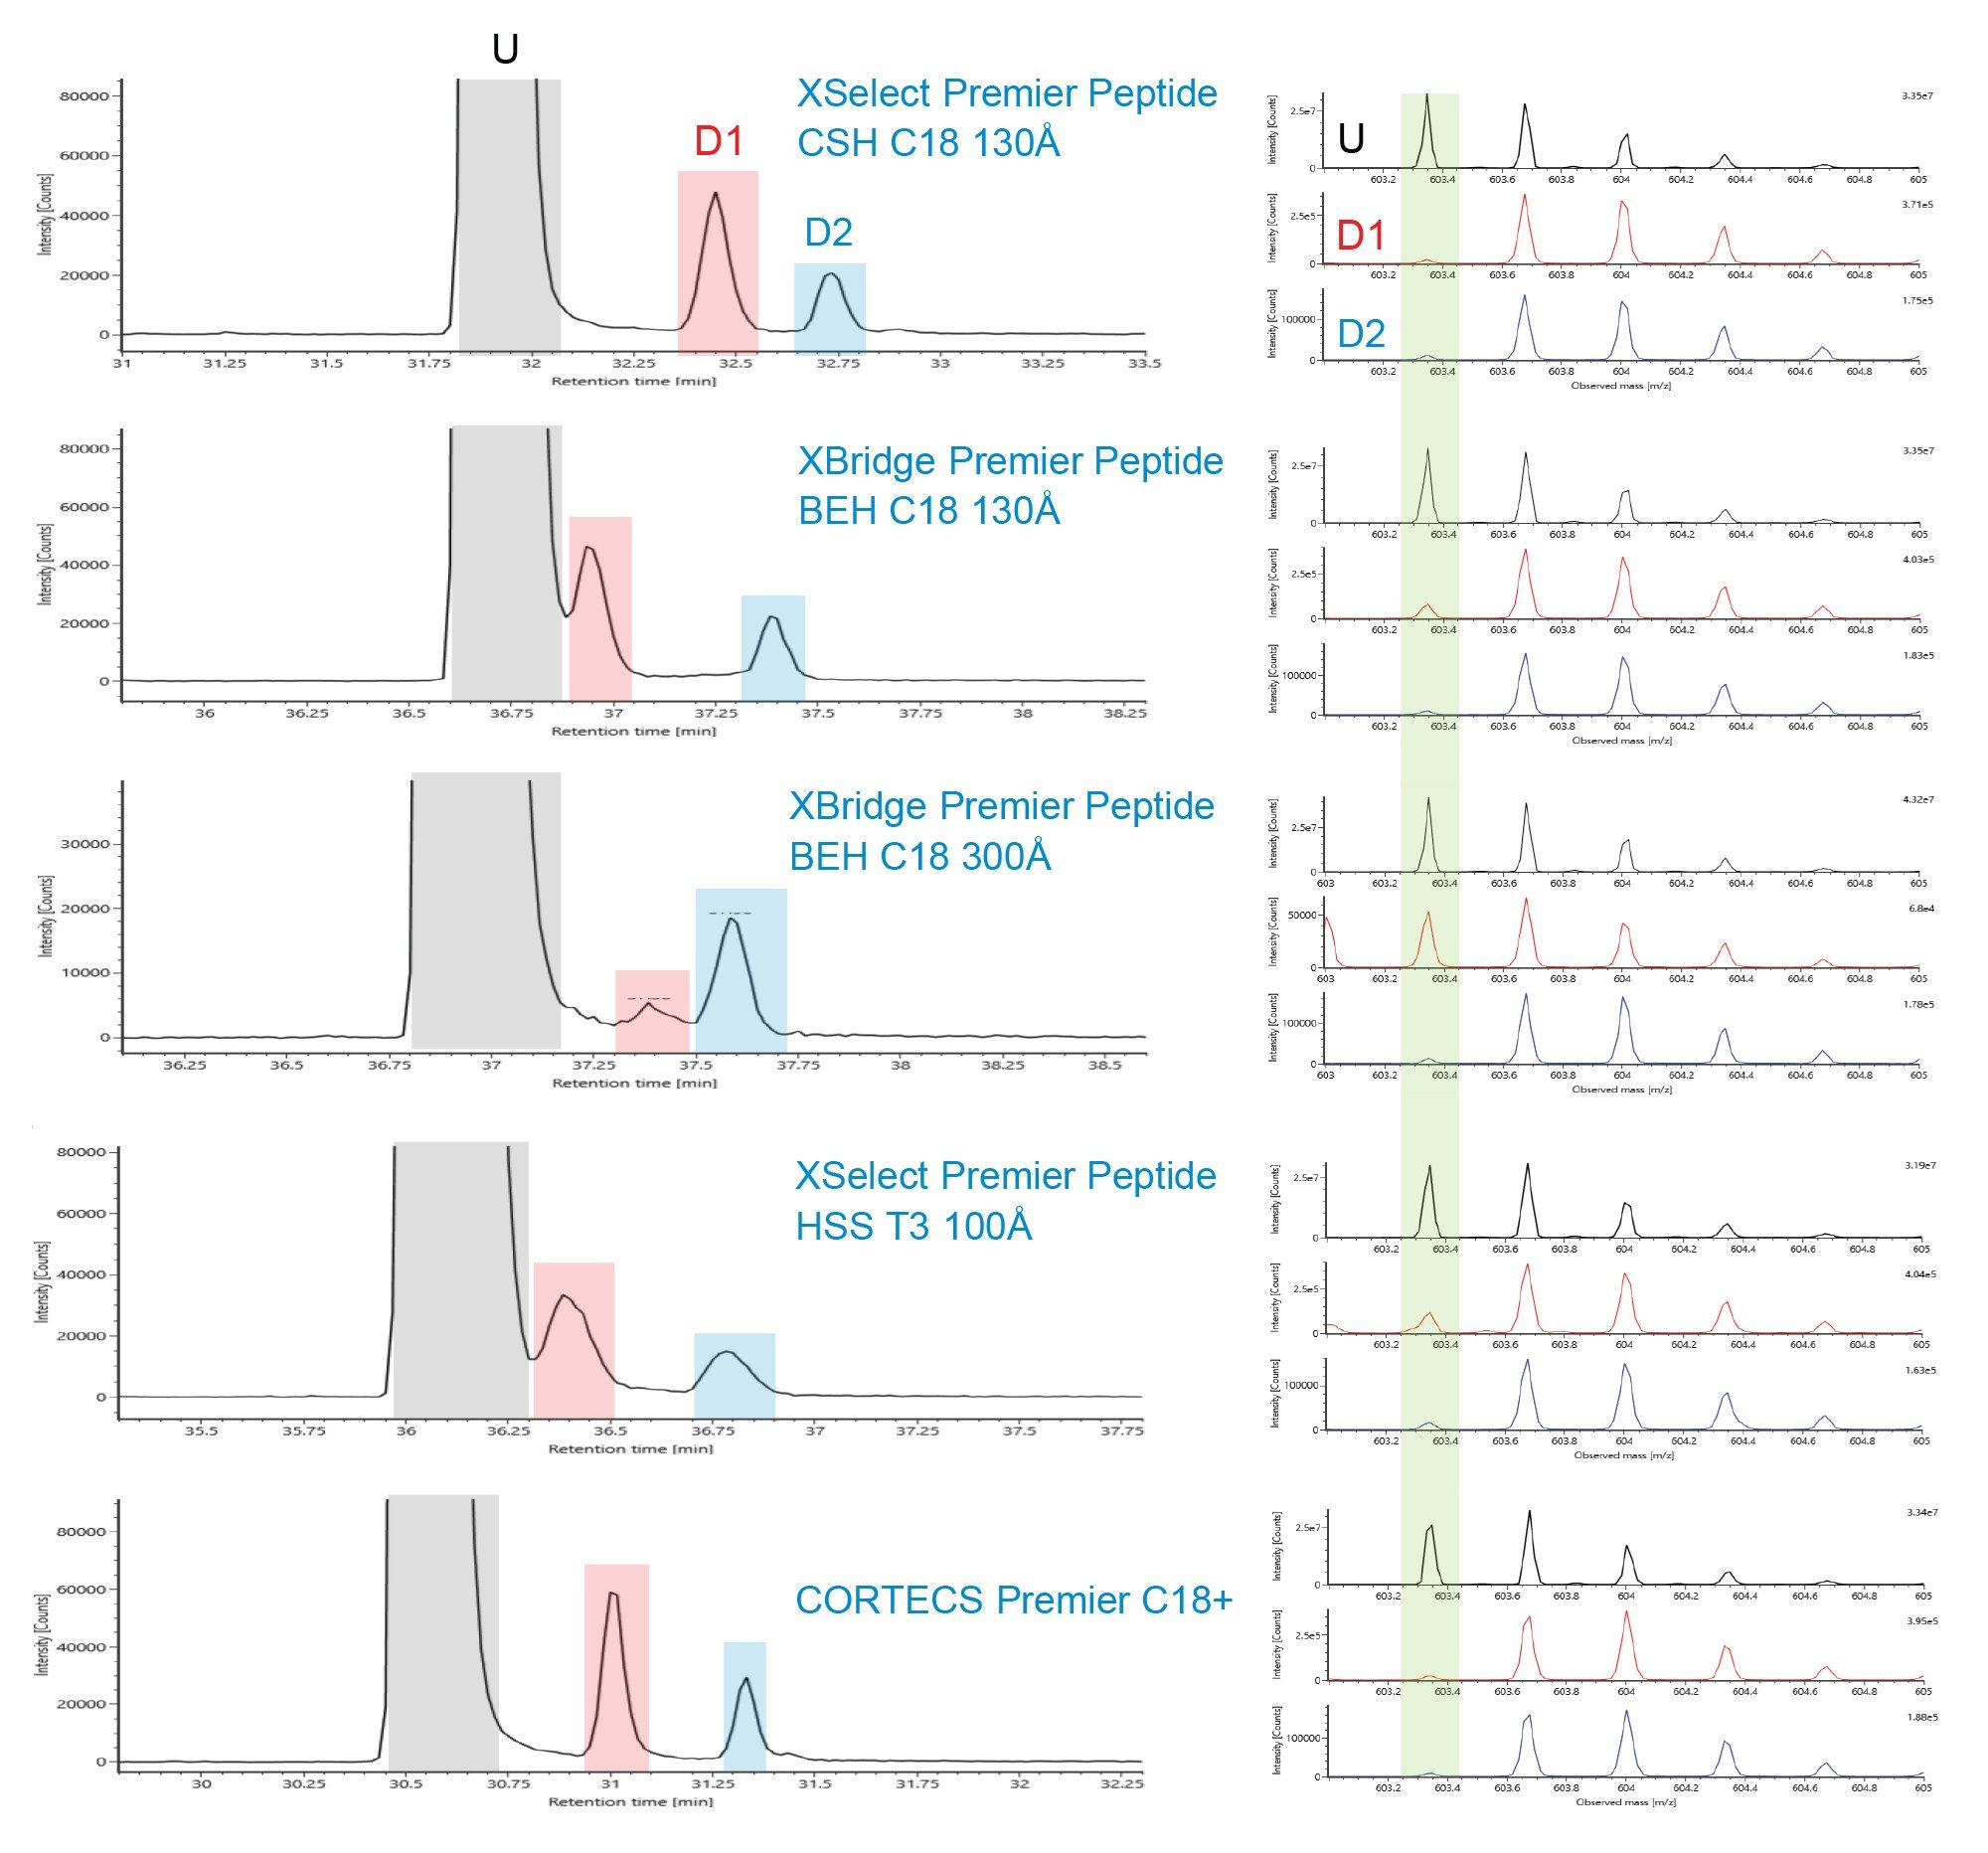
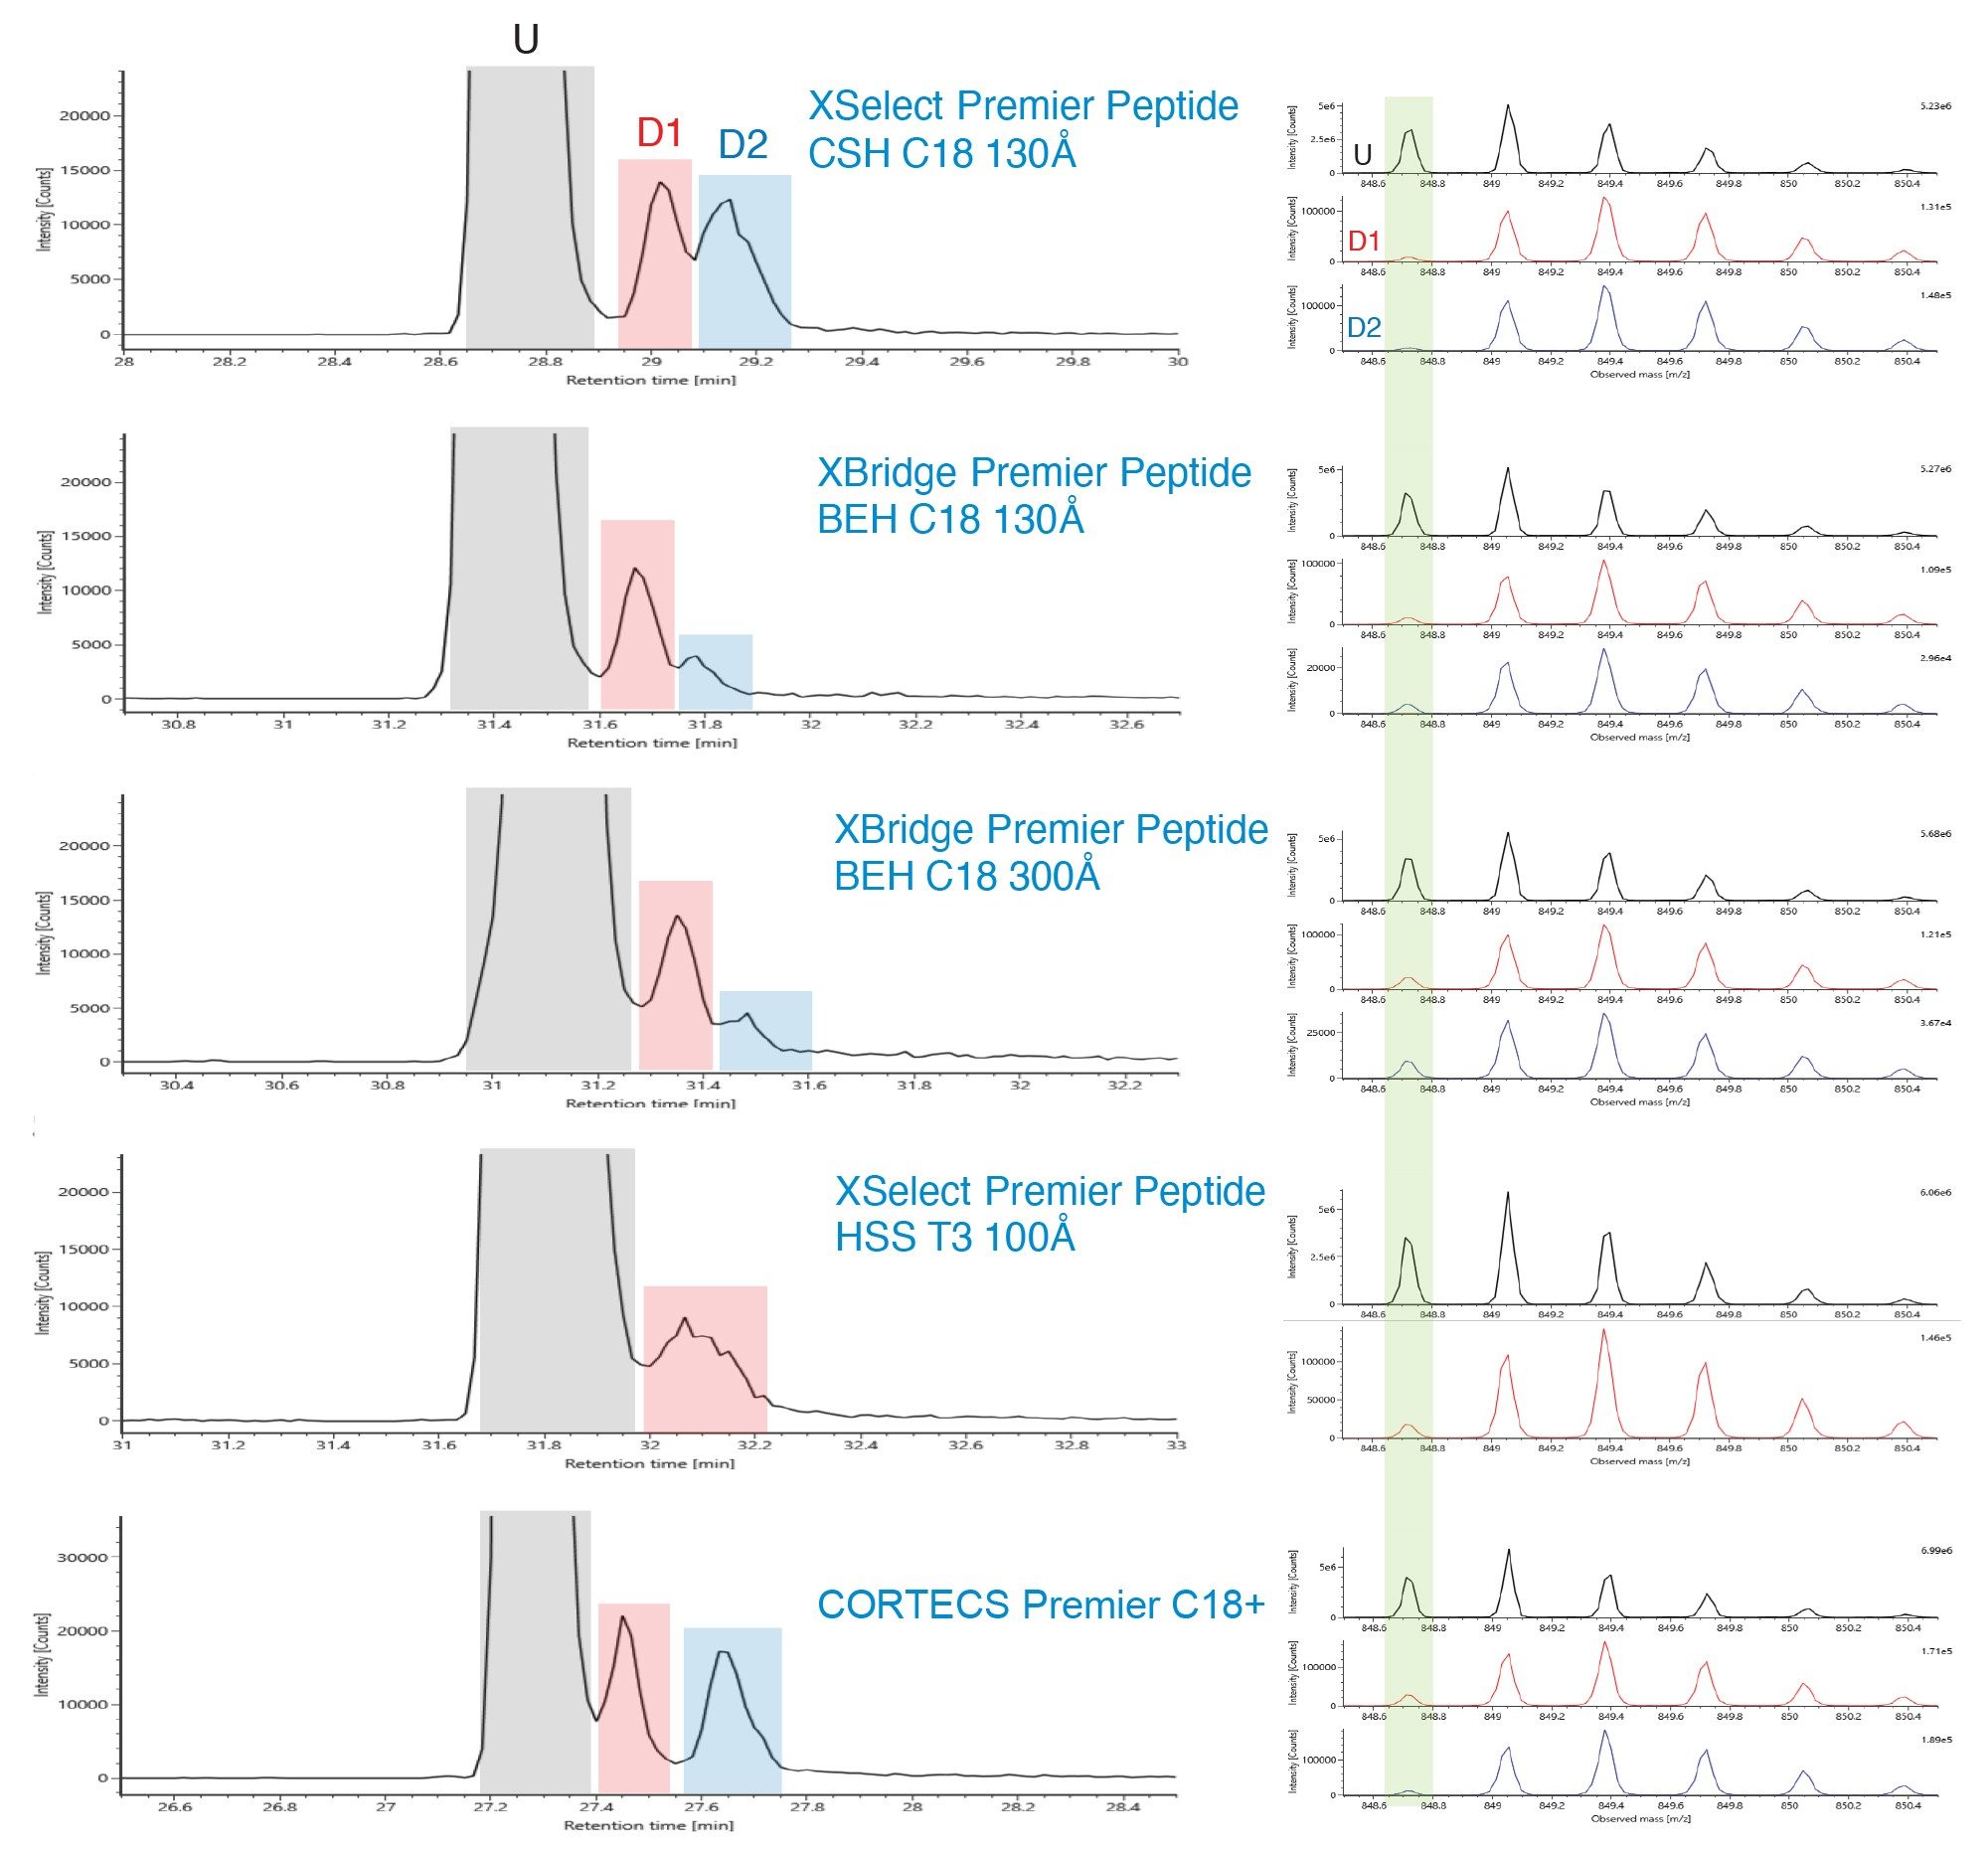
Peptide mapping has been used as Multi-Attribute Method (MAM) for monitoring Critical Quality Attributes (CQAs) in recent years.3,4 As an example in Figure 4 and Figure 5, XIC of two NISTmAb tryptic peptides (Heavy Chain T26 and Heavy Chain T37) and their deamidated forms are shown for the five Premier columns. Spectra of the unmodified peak and its deamidated peaks are shown on the right side. For Heavy Chain T26, the unmodified and the deamidated peak 1 are better separated on the Premier Peptide CSH C18 column and the CORTECS Premier C18+ Column (Figure 4). For Heavy Chain T37, the separation between the unmodified peak and the deamidated peak 1 is better on the Premier Peptide CSH C18 130 Å Column and the Premier Peptide BEH C18 130 Å column (Figure 5). Additionally, the deamidated forms are known to result in a mass shift of ~+1Da. As indicated by the green box on the right side of the figure, the spectra are cleaner for the deamidated form when it is better separated from the unmodified form.
Conclusion
In comparing performance of eight Waters reversed-phase columns for peptide separations, differences in selectivity and peak capacity were observed for the different column chemistries. The use of MaxPeak Premier HPS Column hardware did not significantly alter peptide separation selectivity however different results may have occurred if the peptides were heavily phosphorylated. XIC show that when the NISTmAb tryptic peptides and their deamidated form are better separated, the spectra are cleaner for the deamidated form.
Overall, all of the columns tested provided effective separations for peptide analyses. Features of the different column chemistry1 result in different selectivity, which can be useful in developing a method to separate difficult peptide samples.1
References
- Koza S.M., Chambers E.E. Selecting a Reversed Phase Column for the Peptide Mapping Analysis of a Biotherapeutic Protein. Waters Application Note. 720005924EN. 2017.
- Birdsall R.E., Kellett J., Ippoliti S., Ranbaduge N., Lauber M.A., Yu Y.Q., Chen W. Reducing Metal-Ion Mediated Adsorption of Acidic Peptides in RPLC-Based Assays Using Hybrid Silica Chromatographic Surfaces. Journal of Chromatography B 1179 (2021) 122700.
- Mouchahoir T., and Schiel J.E. Development of an LC-MS/MS peptide mapping protocol for the NISTmAb. Analytical and Bioanalytical Chemistry (2018) 410:2111–2126.
- Guan X., Eris T., Zhang L., Ren D., Ricci M.S., Thiel T., Goudar C.T. A High-Resolution Multi-Attribute Method for Product Characterization, Process Characterization, and Quality Control of Therapeutic Proteins. Analytical Biochemistry 643 (2022) 114575.
720008035, September 2023