Advancing Free Fatty Acid Analysis of Milk and Infant Formula through ACQUITY™ QDa™ II Mass Detector Method Development
Abstract
Free Fatty Acid (FFAs) analysis in milk and infant formula samples is performed for quality control, product development, and regulatory compliance. There is a gap in straightforward FFAs analysis in the food industry. This study provides insight into the method development process for FFAs analysis using LC-MS. A range of LC columns, mobile phases, LC gradients, and flow rates were investigated, followed by sensitivity, repeatability, and initial validation of the final method with selected commercially available samples. The method developed not only offers a reliable FFAs screening solution for milk and infant formula samples but also paves the way for routine FFAs quantification across a spectrum of diverse sample types following further optimization.
Benefits
- Real-time, qualitative, and quantitative LC-MS method development
- Fast chromatographic separation of 19 FFAs ranging from C8:0 to C24:0 in less than six minutes
- Mass information to differentiate between chemical components with similar retention time but different masses
- Highly sensitive and repeatable method
- Easy and quick FFA extraction from authentic samples
Introduction
Fatty acids (FFAs) play a pivotal role in shaping the distinctive sensory and visual characteristics of milk products. However, their substantial impact on flavor requires careful management, as high FFAs concentration can lead to undesirable strong flavors, contributing to rancidity.1 Moreover, the oxidation of these fatty acids present yet another challenge, manifesting as reduced palatability and a deterioration in the quality of milk products. This degradation process results in the development of an unappealing 'rancid' flavor profile, stemming from the breakdown of lipids into aldehydes, ketones, and alcohols.2 The task of preserving an optimal flavor profile gains paramount importance, particularly in the context of infant formula formulations, as these serve as the foundational components of an infant's dietary intake.
The systematic screening of FFAs within infant formula and milk is of paramount importance, serving a multitude of critical functions encompassing quality control (QC), product advancement, authentication, and legislative compliance. These FFAs constitute an indispensable component of both the nutritional and flavor profiles within infant formula and milk. Beyond their role as an energy source, FFAs also act as vital carriers for fat-soluble vitamins such as A, D, E, and K. Furthermore, their significance extends to the provision of physical protection for infants through the establishment of a protective fat layer, concurrently fostering visual and nervous system development. Consequently, the meticulous scrutiny of infant formula is globally mandated, underscoring the rigorous regulatory examinations it undergoes. Additionally, the identification and quantification of odd-chain saturated fatty acids, notably C15:0 and C17:0, hold profound implications as biomarkers for conditions such as type-2 diabetes mellitus, stroke, and cause-specific mortality. Thus, accentuating the broader relevance and impact of FFA analysis beyond the scope of infant formula and milk assessment.3,4
Fatty acids, characterized by their non-polar nature, require a chromatographic column with relatively low polarity to facilitate efficient chromatographic separation. Moreover, the elution process demands a sharp organic gradient to ensure optimal separation. Currently, the assessment of free fatty acids predominantly relies on gas chromatography (GC), often coupled with a flame ion detector (FID) or a high-resolution mass spectrometer (HRMS). However, the GC analysis entails the conversion of fatty acids into fatty acid methyl esters (FAMES), a step that frequently introduces challenges such as amplified levels of MS noise, compromised response sensitivity, production of artifacts, increased expenses, and analytical complexity.
In contrast, the utilization of liquid chromatography-mass spectrometry (LC-MS) as an alternative, holds several notable benefits. In addition to being more user-friendly, unlike GC, LC-MS obviates the need for fatty acid derivatization, thereby eliminating associated complications like analyst error etc., while preserving the integrity of the sample.
The prevailing FFA analysis techniques outlined earlier typically exhibit traits of being intricate, costly, and reliant on complicated mass spectrometry method setups. In contrast, this study introduces a streamlined and routine approach for FFA analysis, employing a standardized FFA mixture on an LC coupled to an ACQUITY QDa II Mass Detector, yielding results within less than six minutes per sample.
Experimental
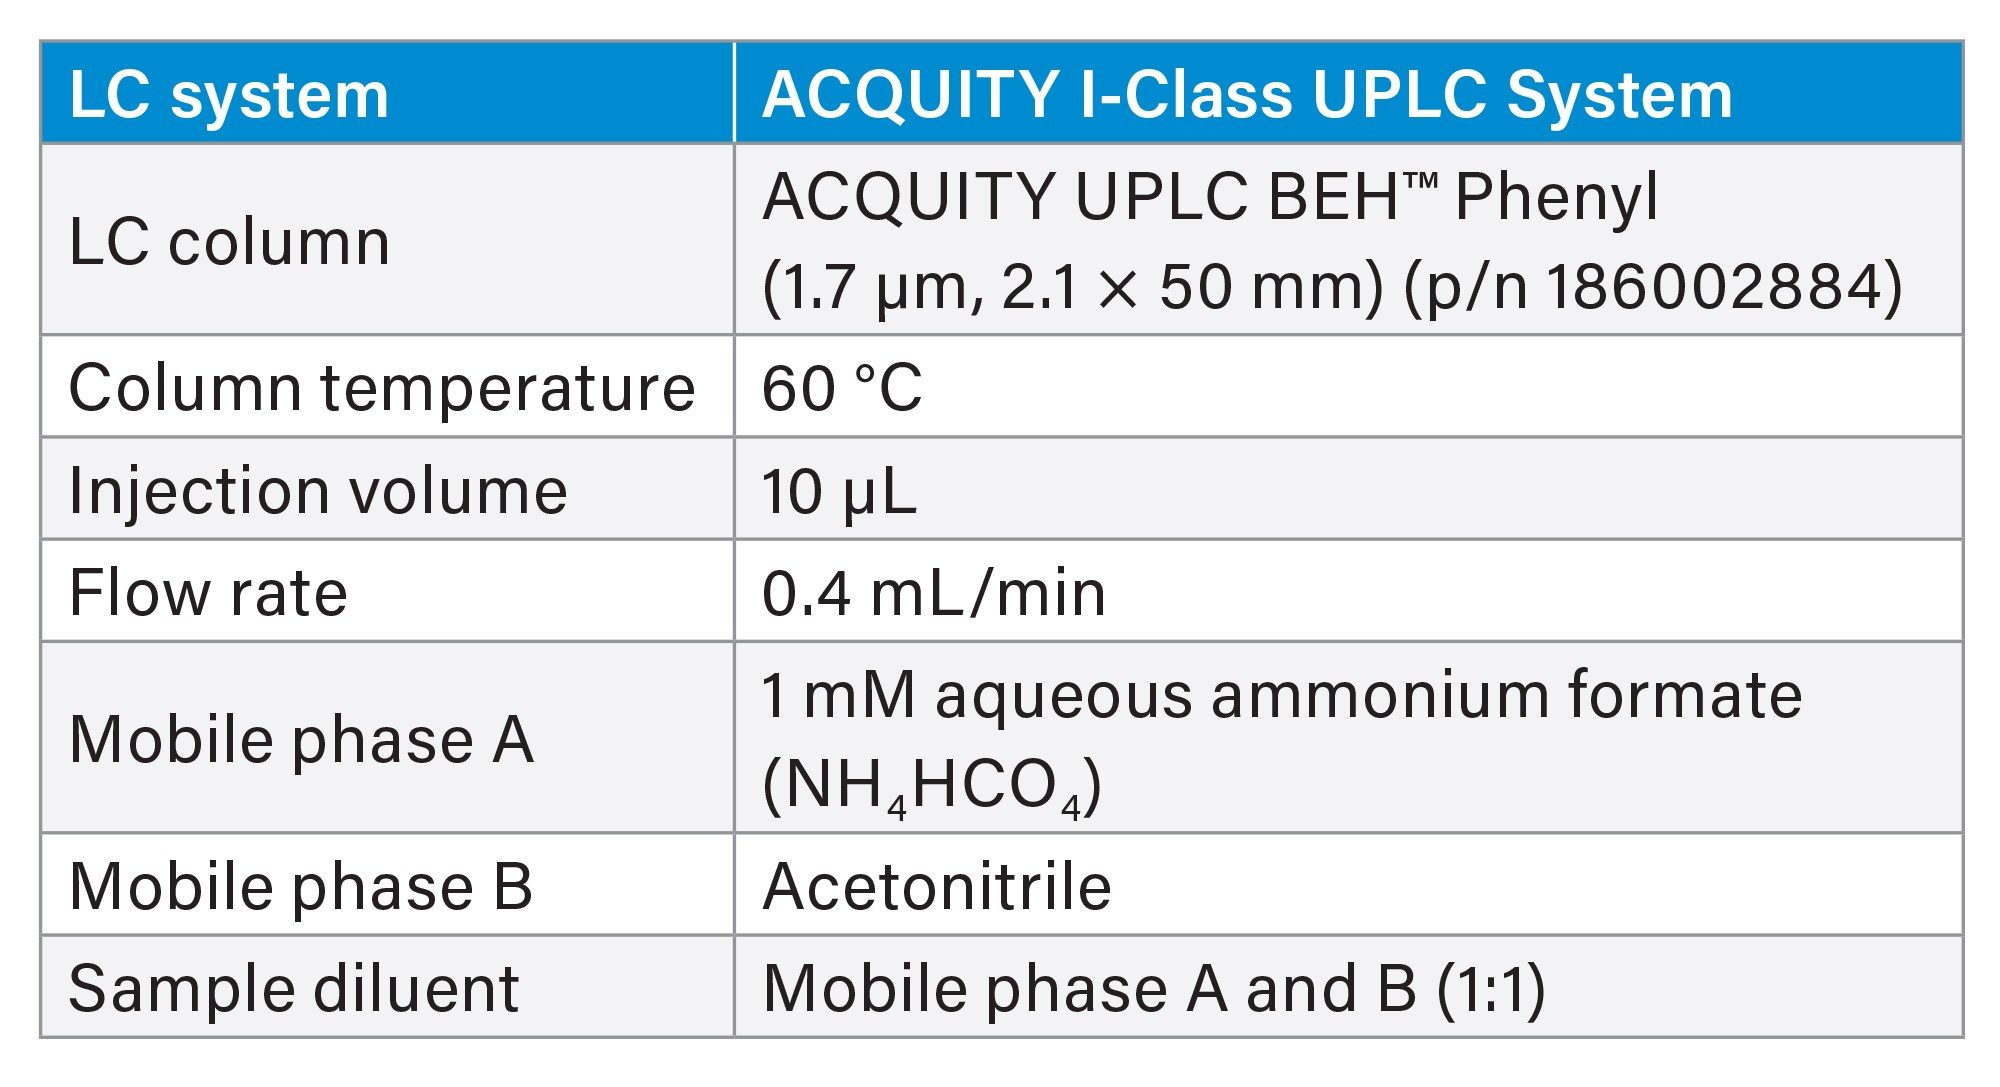 Table 1. LC Parameters.
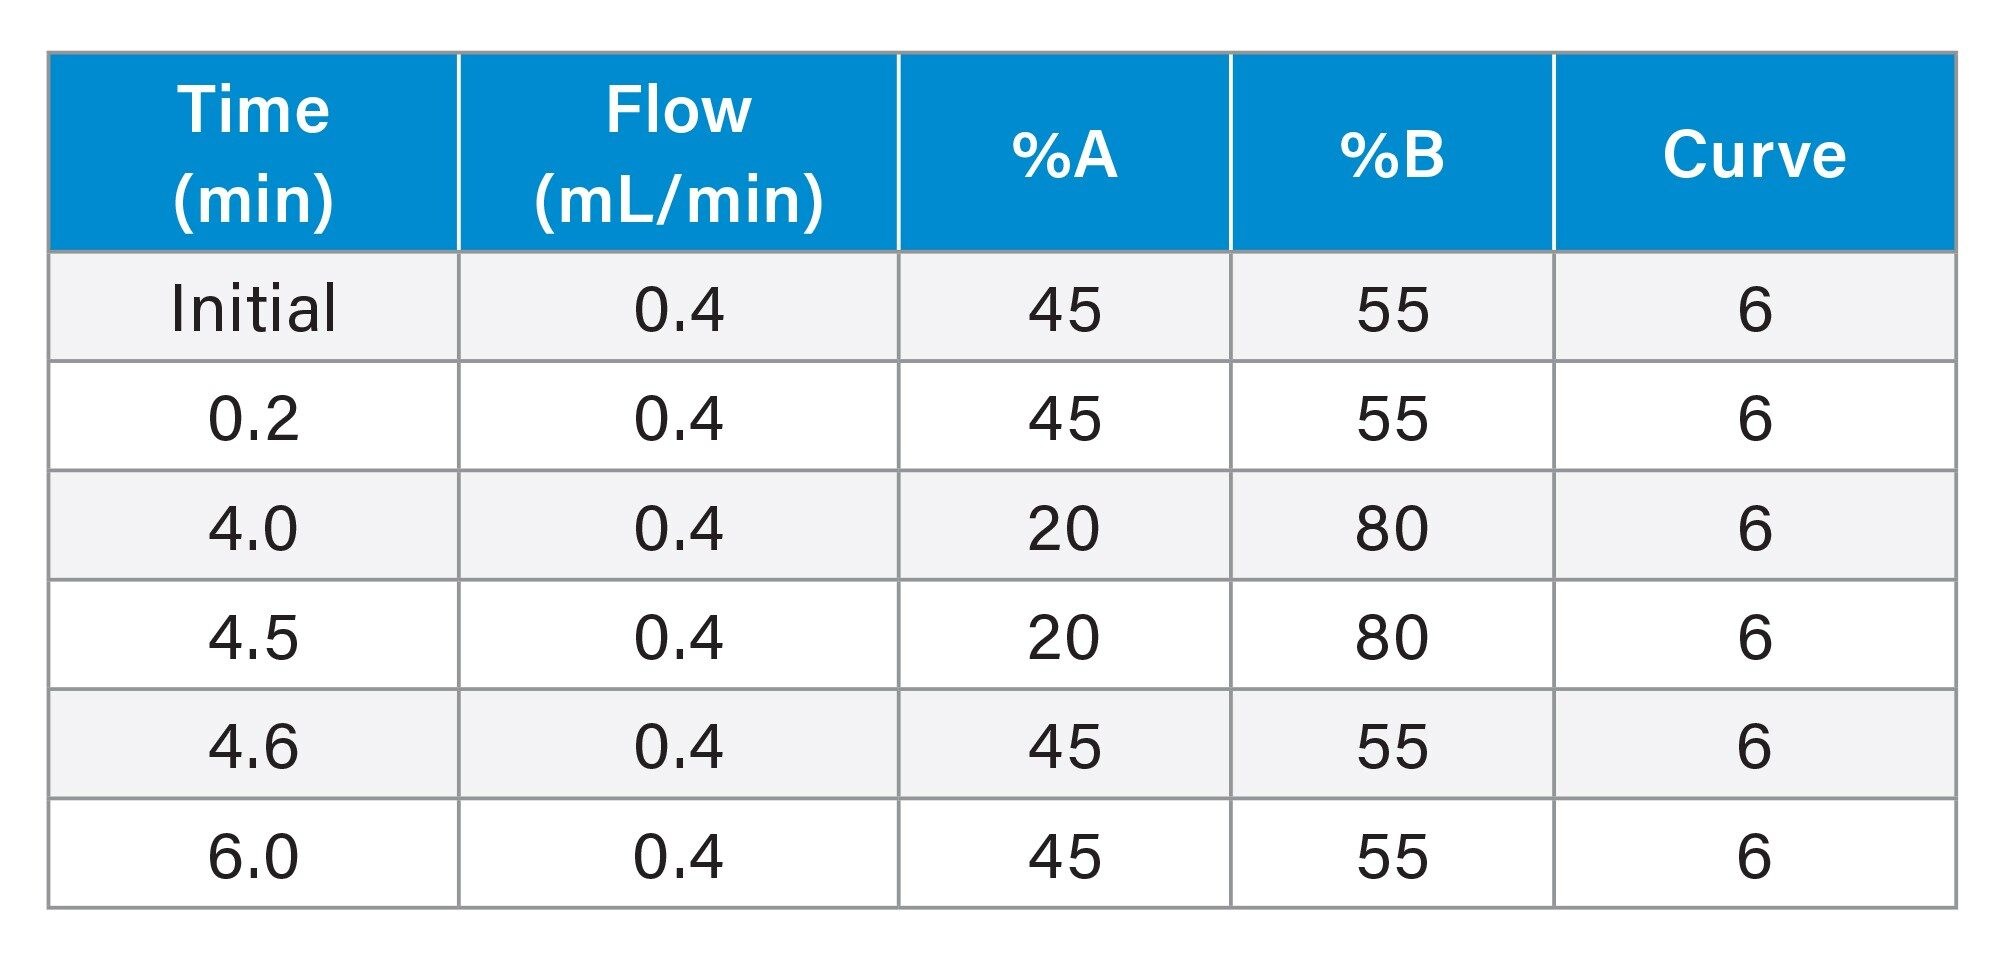 Table 2. LC Gradient.
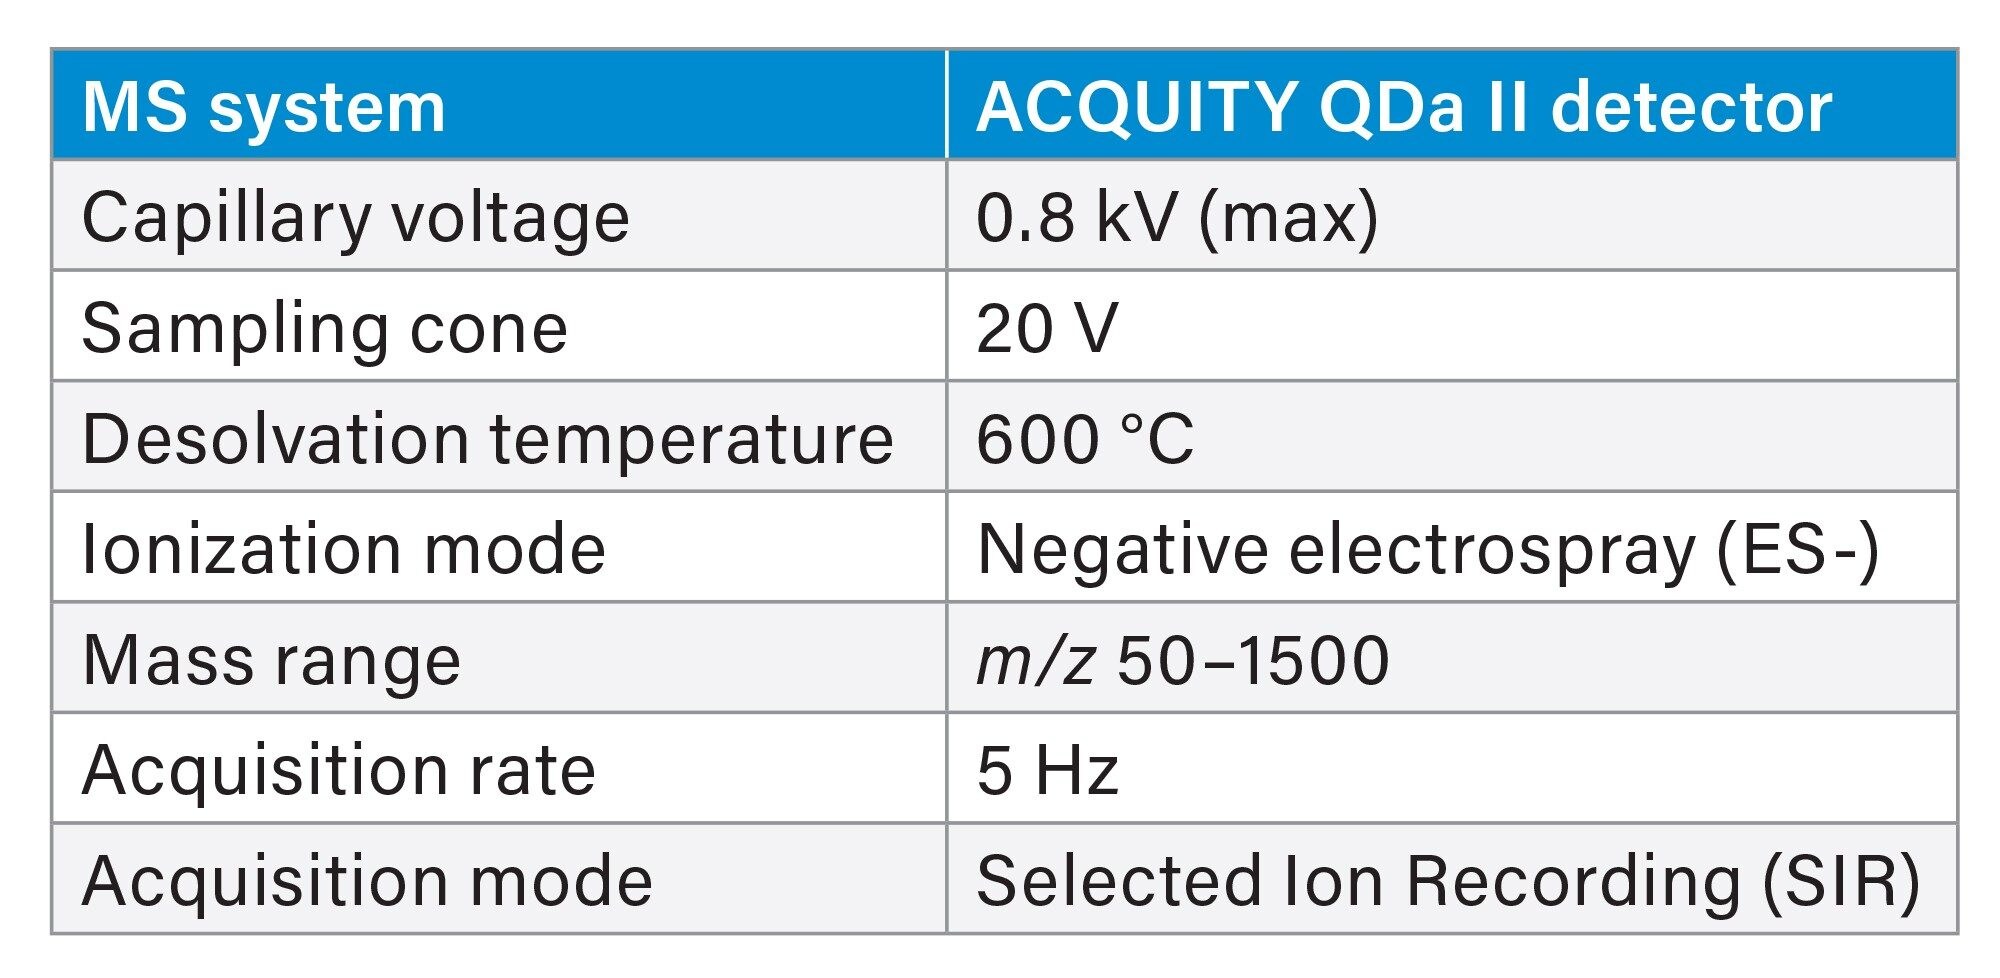 Table 3. MS Parameters.
Data Management
Data acquisition was completed using MassLynx™ 4.2 and data processing was performed using TargetLynx™.
Sample
A GLC reference standard 426, containing 20 free fatty acids ranging from C6:0 to C24:0 was purchased for analysis from Nu-Chek Prep (MN, USA). The standard contained each component in % by weight ranging from 2–16% (Table 3). The concentration of each FFA component in the standard mix was analogous to an authentic sample..
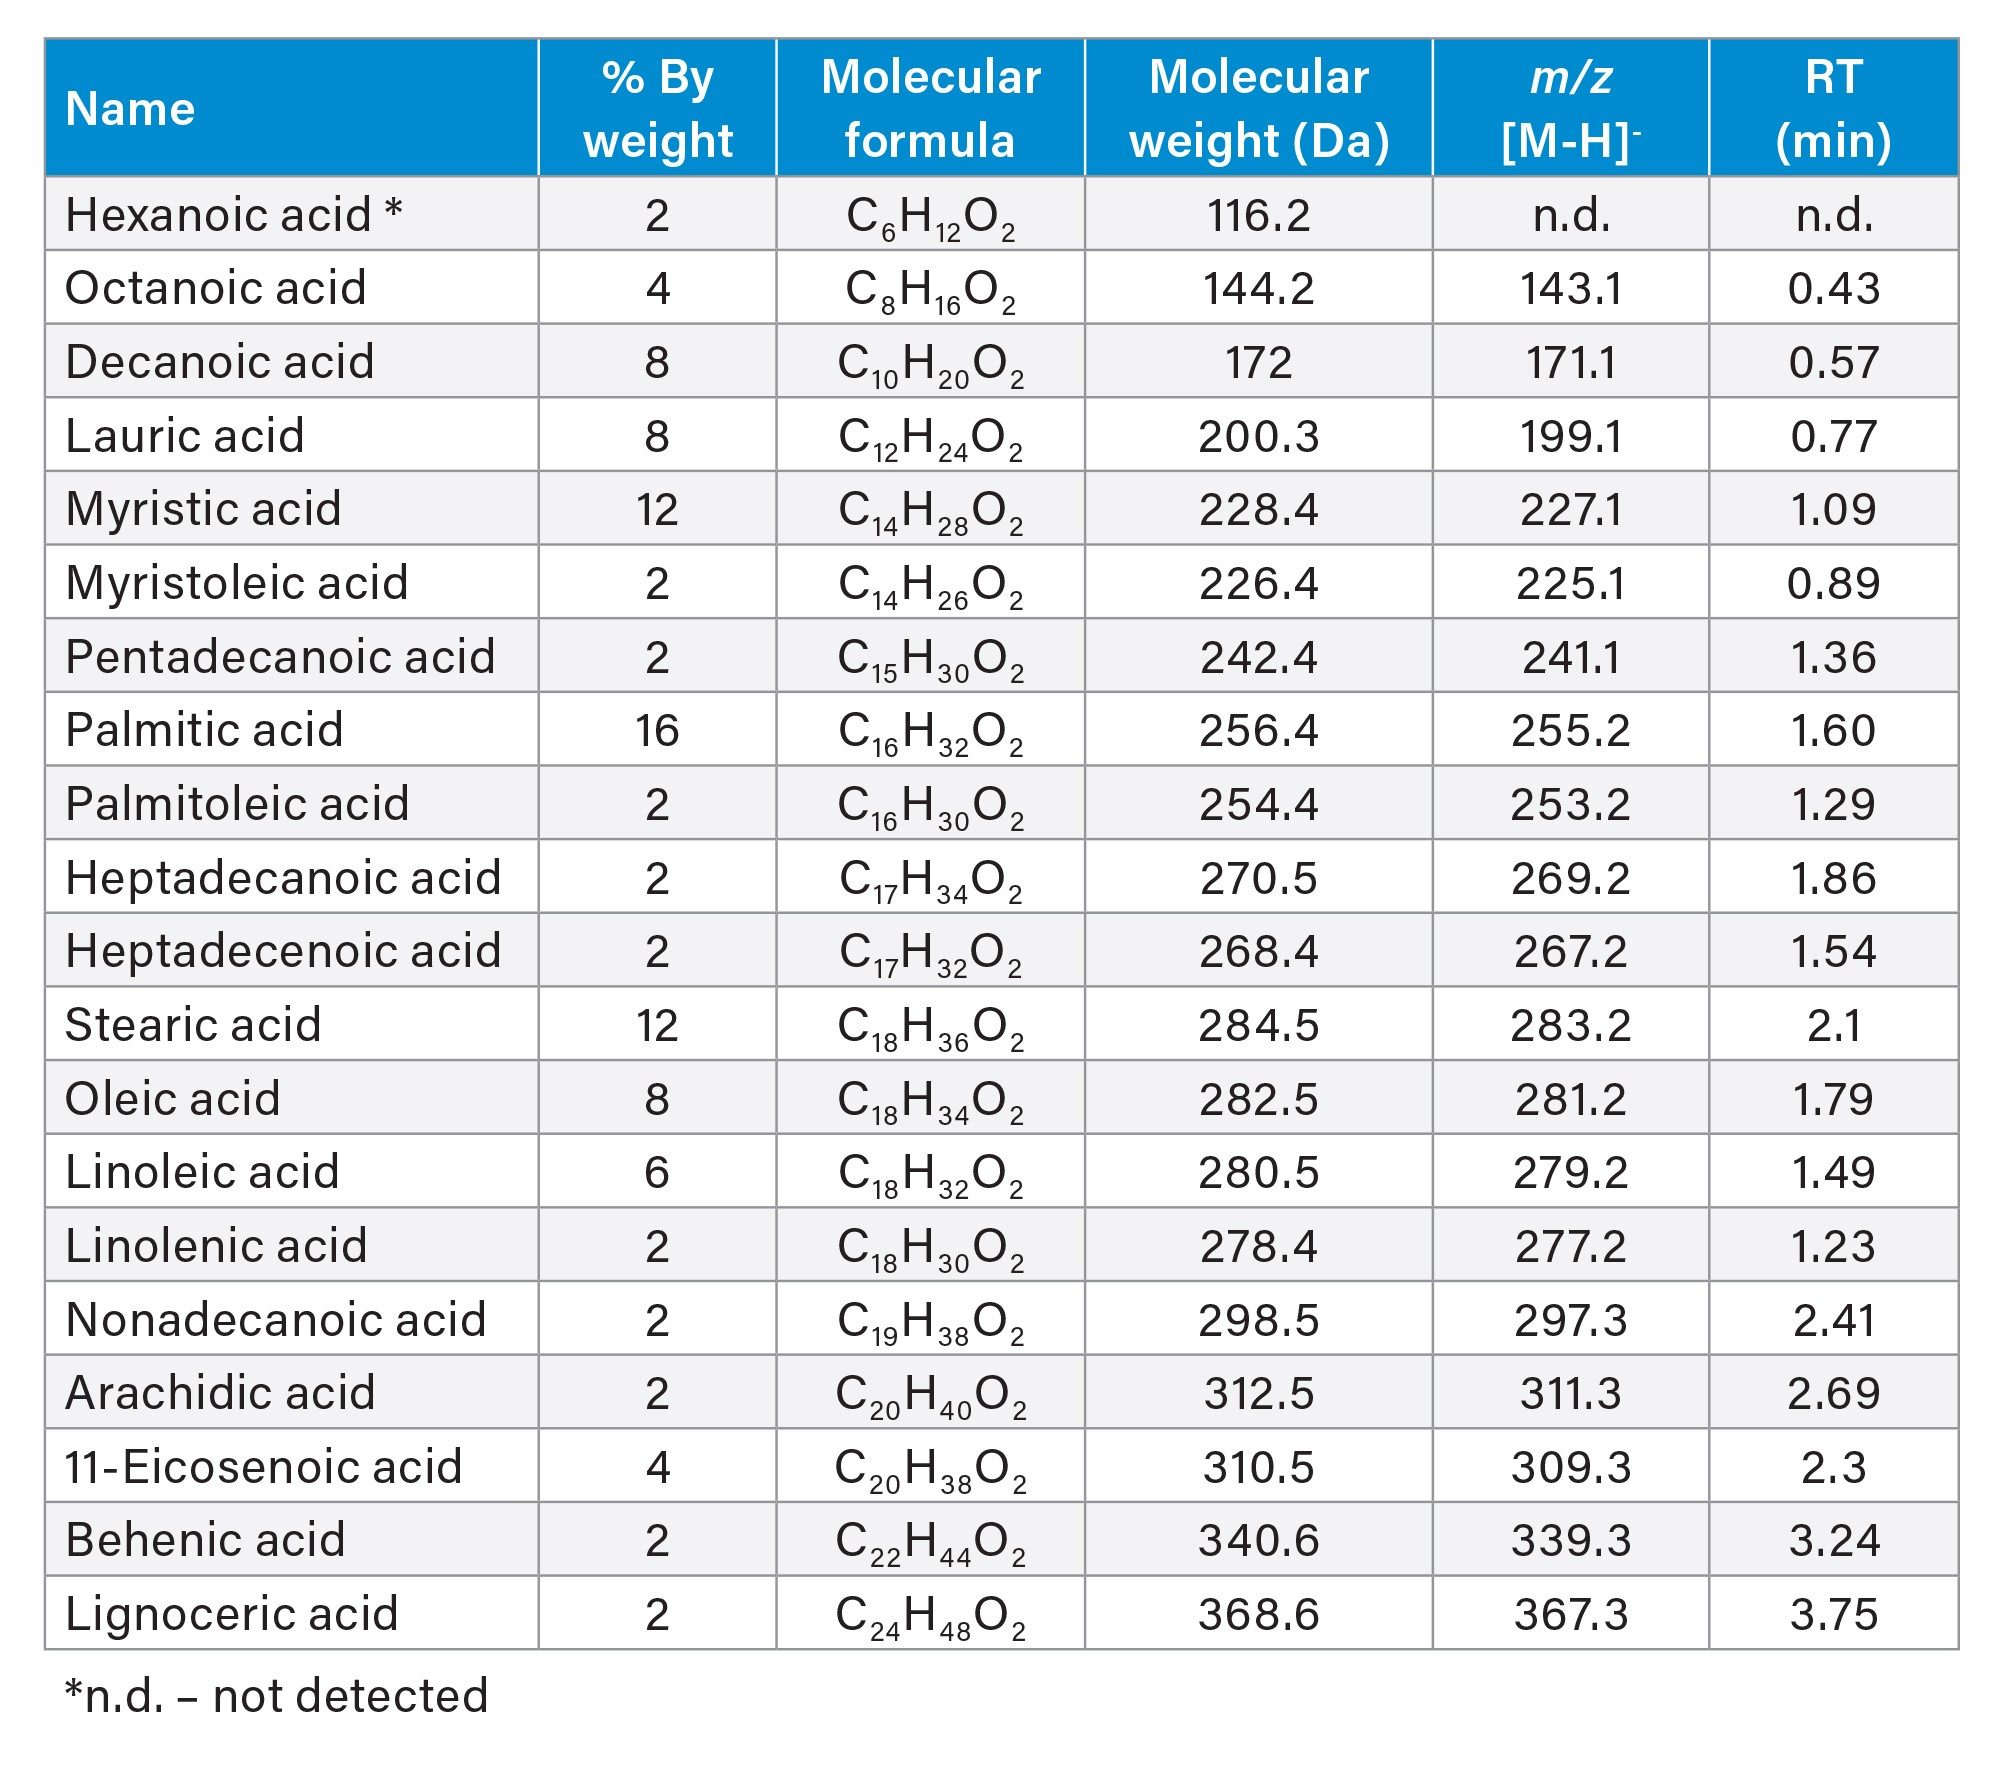 Table 4. Free fatty acids in standard mix.
Milk and infant formula samples, commercially available, were diluted with methanol (MeOH) (1:5) and centrifuged at 10,000 g for five minutes. The resulting supernatant was further diluted with deionized water (1:5). The solution was then diluted with mobile phases A and B (1:1) and transferred into LC vials for LC-MS analysis.
Results and Discussion
Chromatographic Separation
The first step of the LC-MS method development was screening of suitable LC columns and mobile phases. FFAs can vary in terms of their polarity due to the length of their hydrocarbon chains and the presence of functional groups like carboxylic acids. Shorter-chain FFAs with fewer carbons are generally less polar, while longer-chain FFAs with more carbons tend to be more polar due to the presence of the carboxylic acid group.
Three ACQUITY UPLC Columns were tested for this application, namely, AX BEH C18, CSH C18, and BEH phenyl Column. The AX and CSH columns resulted in insufficient peak separation of targeted FFAs and required high organic gradient, >80%, which decreases peak response as the MS source needs water to perform ionization at optimal efficiency. The phenyl column provided optimal peak separation within a six minute gradient for 19 out of 20 components of the mix, ranging from C8:0 to C24:0.
Regardless of the composition of mobile phase B, it was concluded that 1 mM aqueous ammonium formate (NH4HCO4) in mobile phase A was essential to ionize FFAs in the sample. Concentrations higher than 1 mM NH4HCO4 caused a significant reduction in signal (Figure 1).
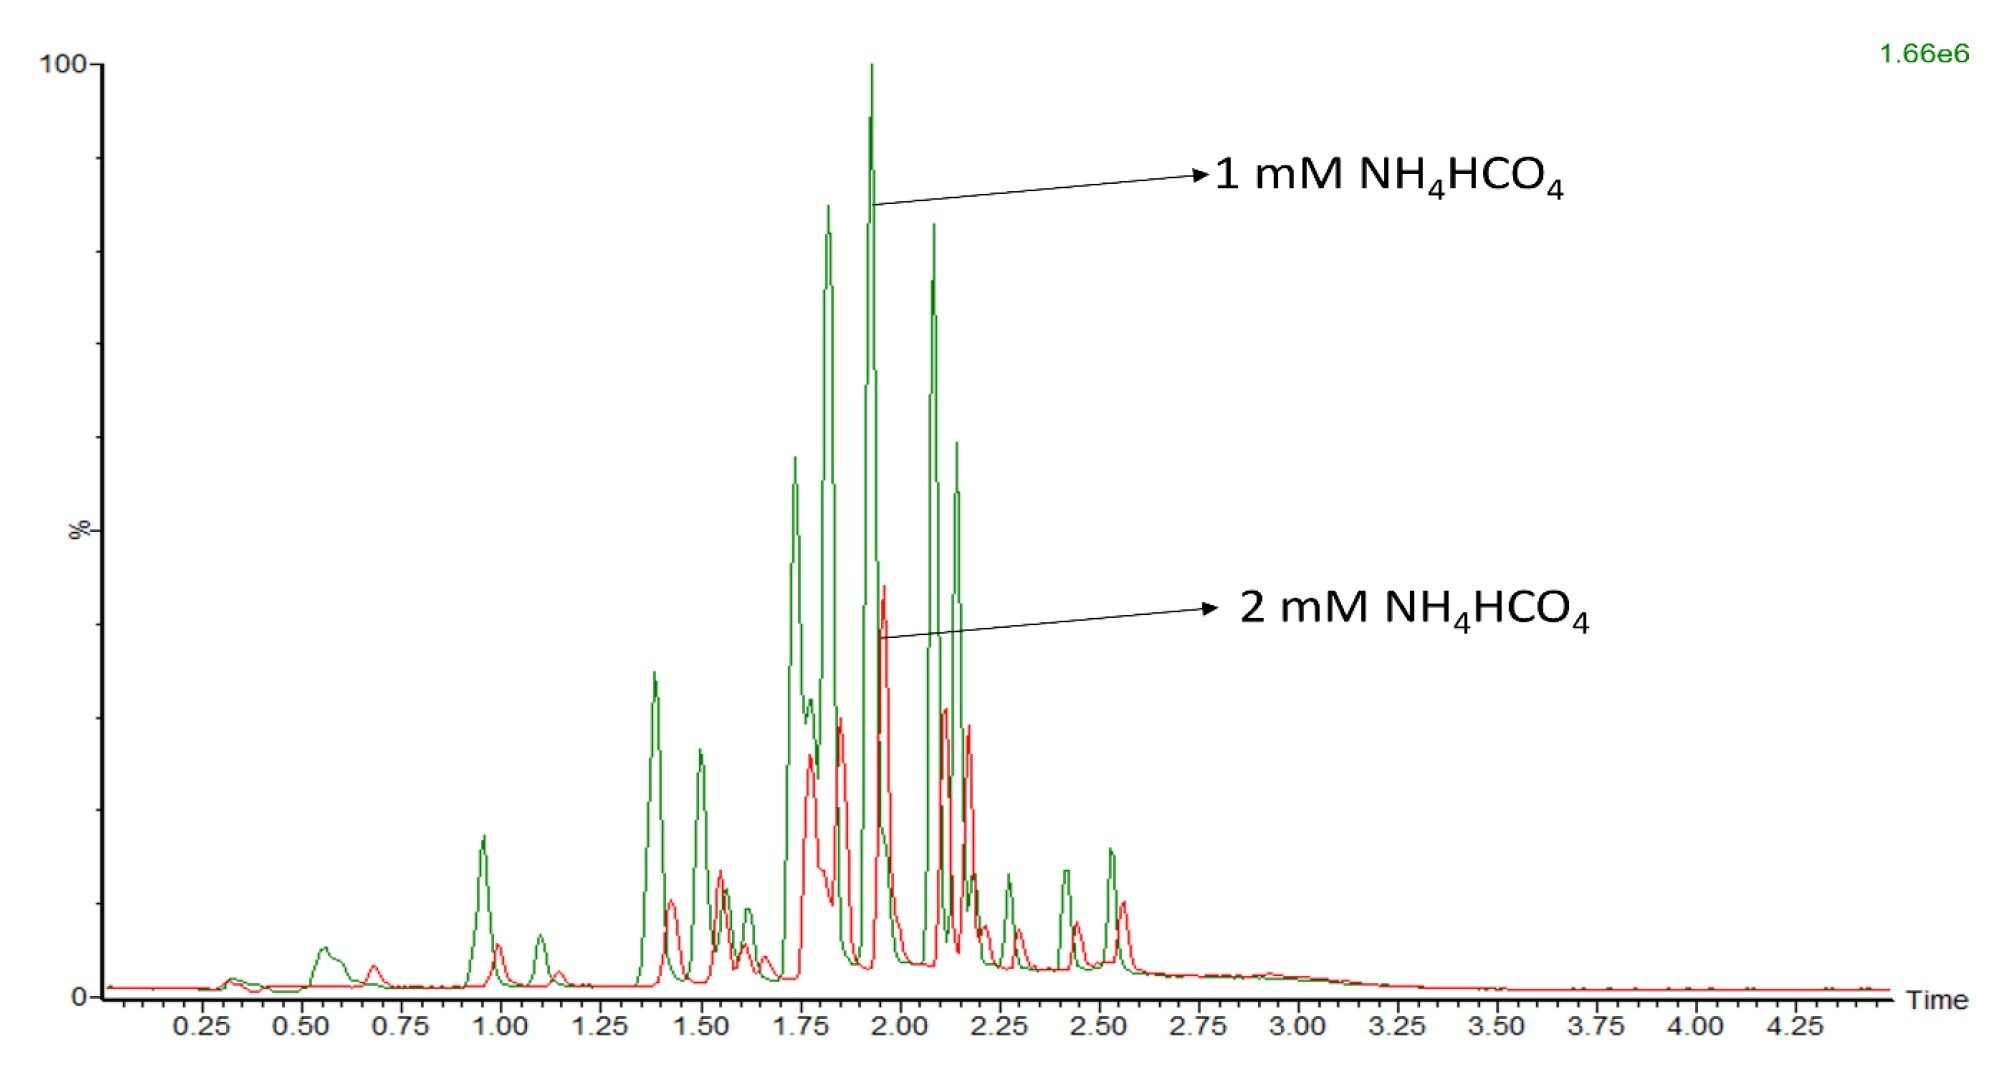 Figure 1. A five fold reduction in signal was observed when 2 mM NH4HCO4 (red) was used as additive instead of 1 mM NH4HCO4 in mobile phase A (green). The on-column standard mix amount was 10 ng for each test.
 Table 5. Test methods for LC-MS FFAs analysis method development. *Final method conditions established upon method development steps.
Three methods were tested prior to establishing the final method as described above (Table 5). All methods used the same mobile phase A. Mobile phase B affects peak separation and MS response. Using isopropanol (IPA) and acetonitrile (ACN) (1:1) as mobile phase B provided improved peak shape and response; however, high background noise was consistently observed (Figure 2).
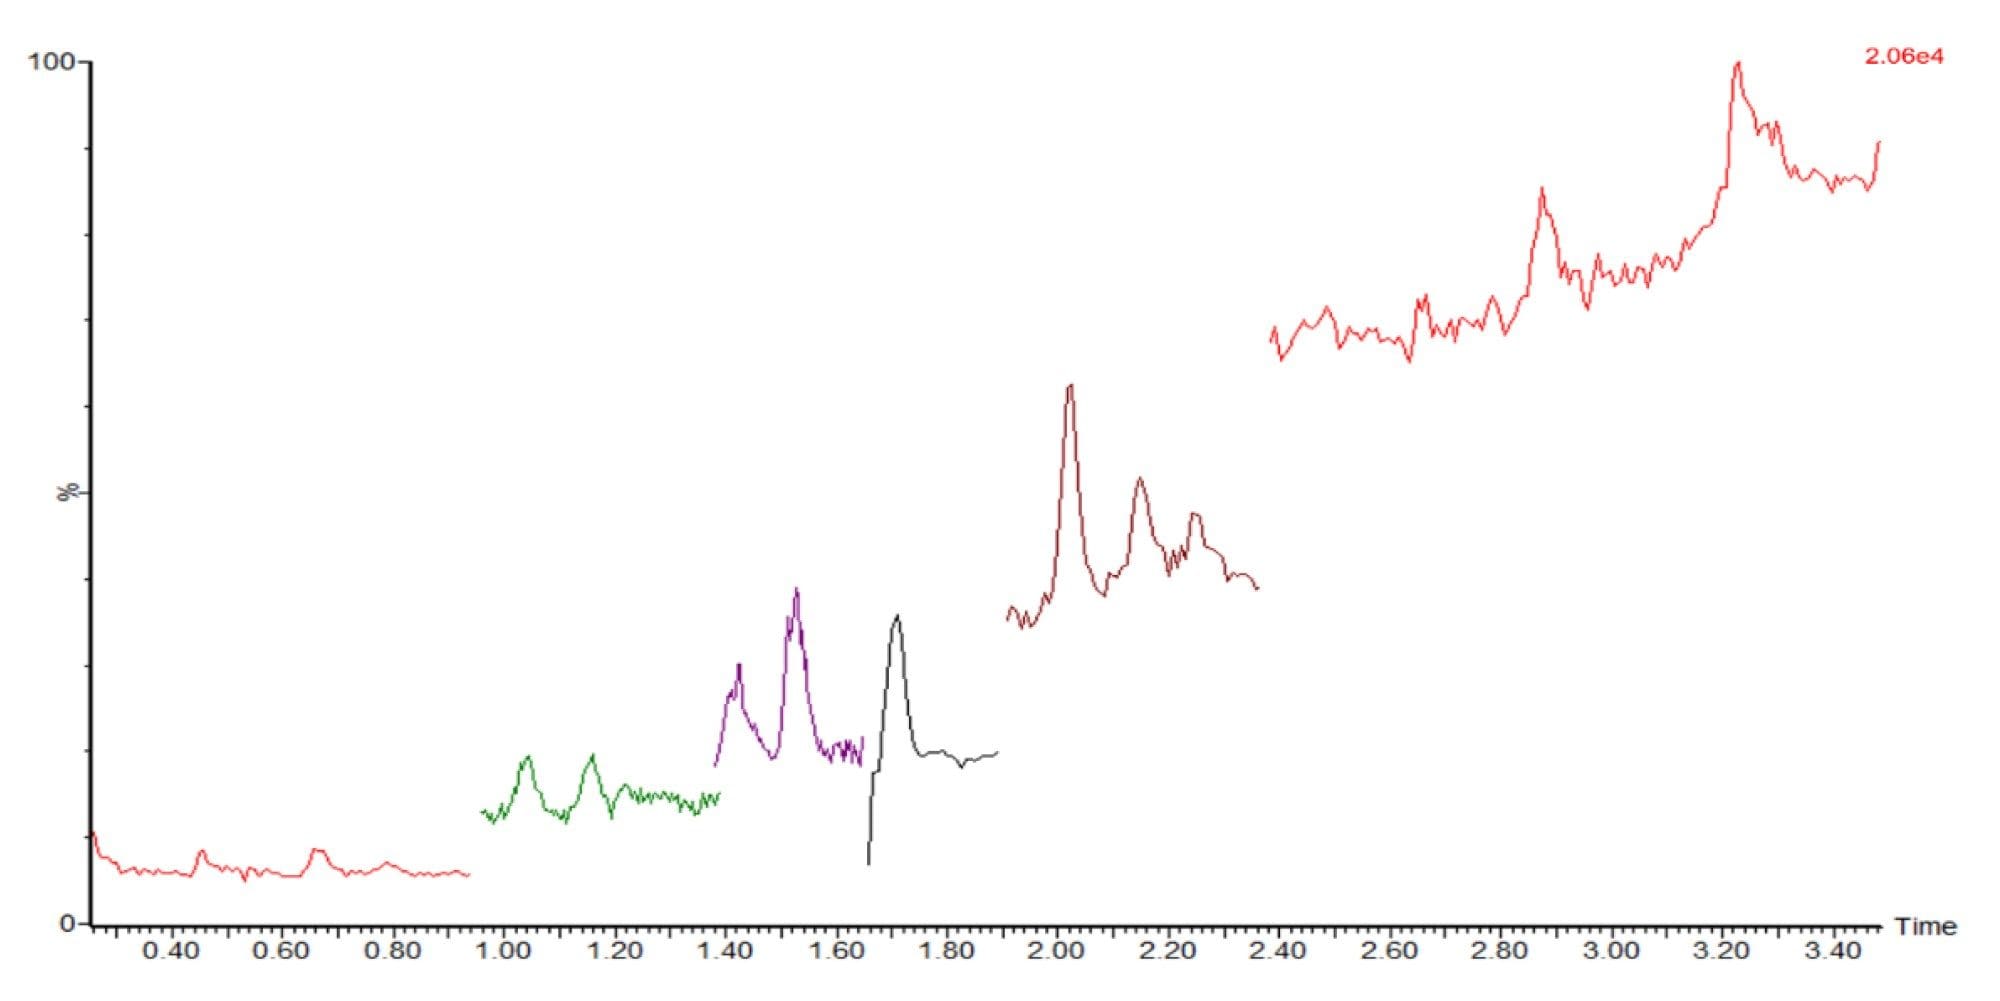 Figure 2. High background noise with IPA: ACN (1:1) as mobile phase B when analyzing 500 pg/µL FFA standard mix on column.
Using methanol as mobile phase B provided similar response and sensitivity to ACN, however, it required a very high organic gradient (70–90%) which led to poor ionization and resulted in broad, tailed peaks.
The final method conditions used were with ACN as mobile phase B as this allowed for good peak separation, sensitivity for most FFAs in the standard mix and repeatability at less than 8% RSD for all components (Table 6). Sensitivity was defined as lower limit of quantitation (LLOQ) of <10 pg/µL (ppb) corresponding to 0.01 mg/L in infant formula or milk samples (Table 7).
Due to the large range of FFAs components in the standard mix and chemical nature of FFAs, it was important to match the sample diluent to the composition at the start of the gradient. A 10-fold increase in response was observed for later eluting components when mobile phases A:B (1:1) were used as a sample diluent instead of MeOH: H2O (1:1) when using ACN as mobile phase B (Figure 3).
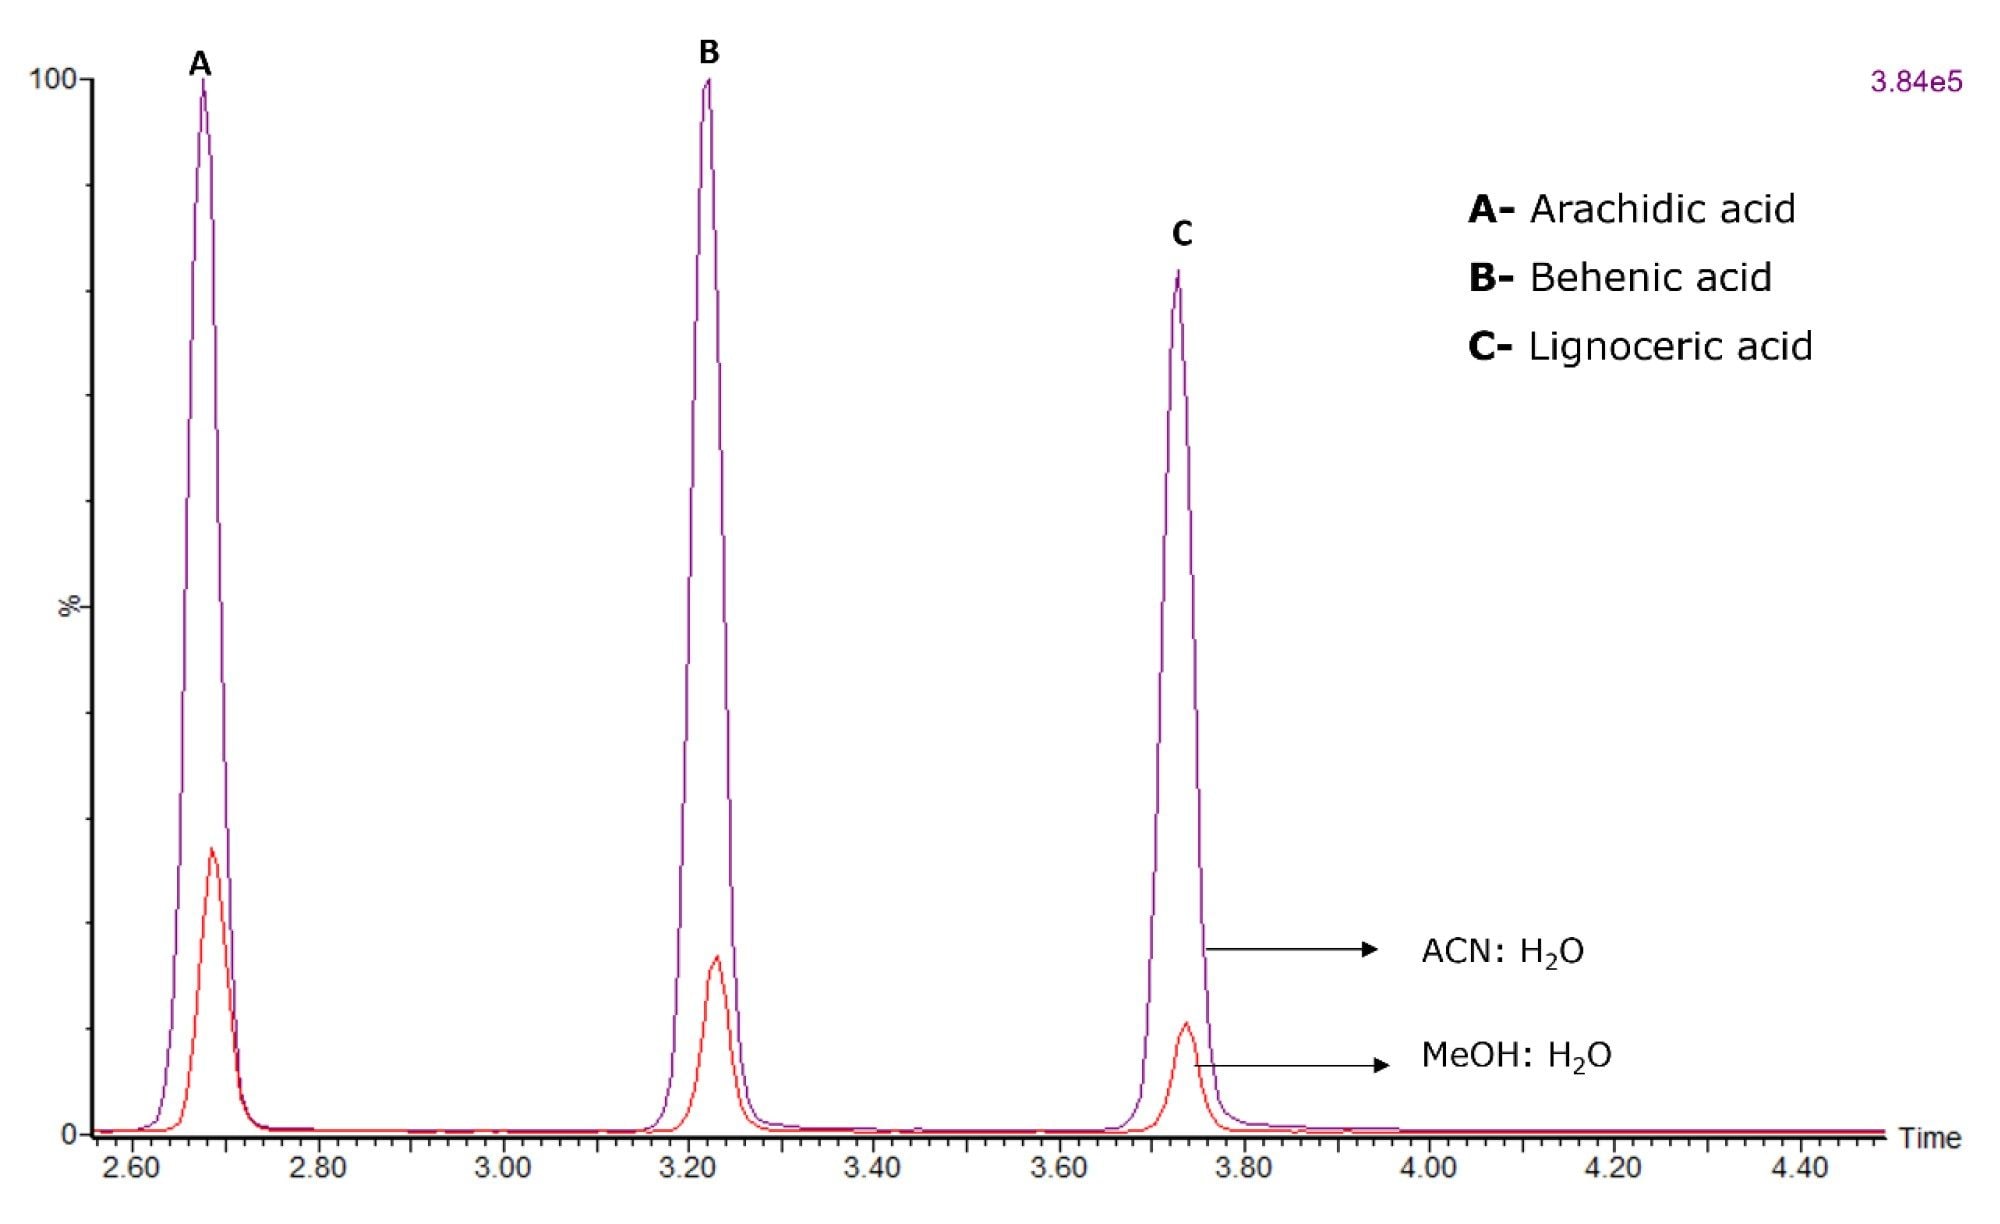 Figure 3. Effect of diluent on FFAs LC-MS analysis. The FFA standard on-column amount was 500 pg/µL for each injection.
A range of flow rates and mobile phase gradients were tested to increase peak separation without decreasing peak response. Upon assessing flow rates ranging from 0.8 mL/min to 0.3 mL/min, 0.4 mL/min was established as the flow rate that gave optimum QDa II performance (Figure 4).
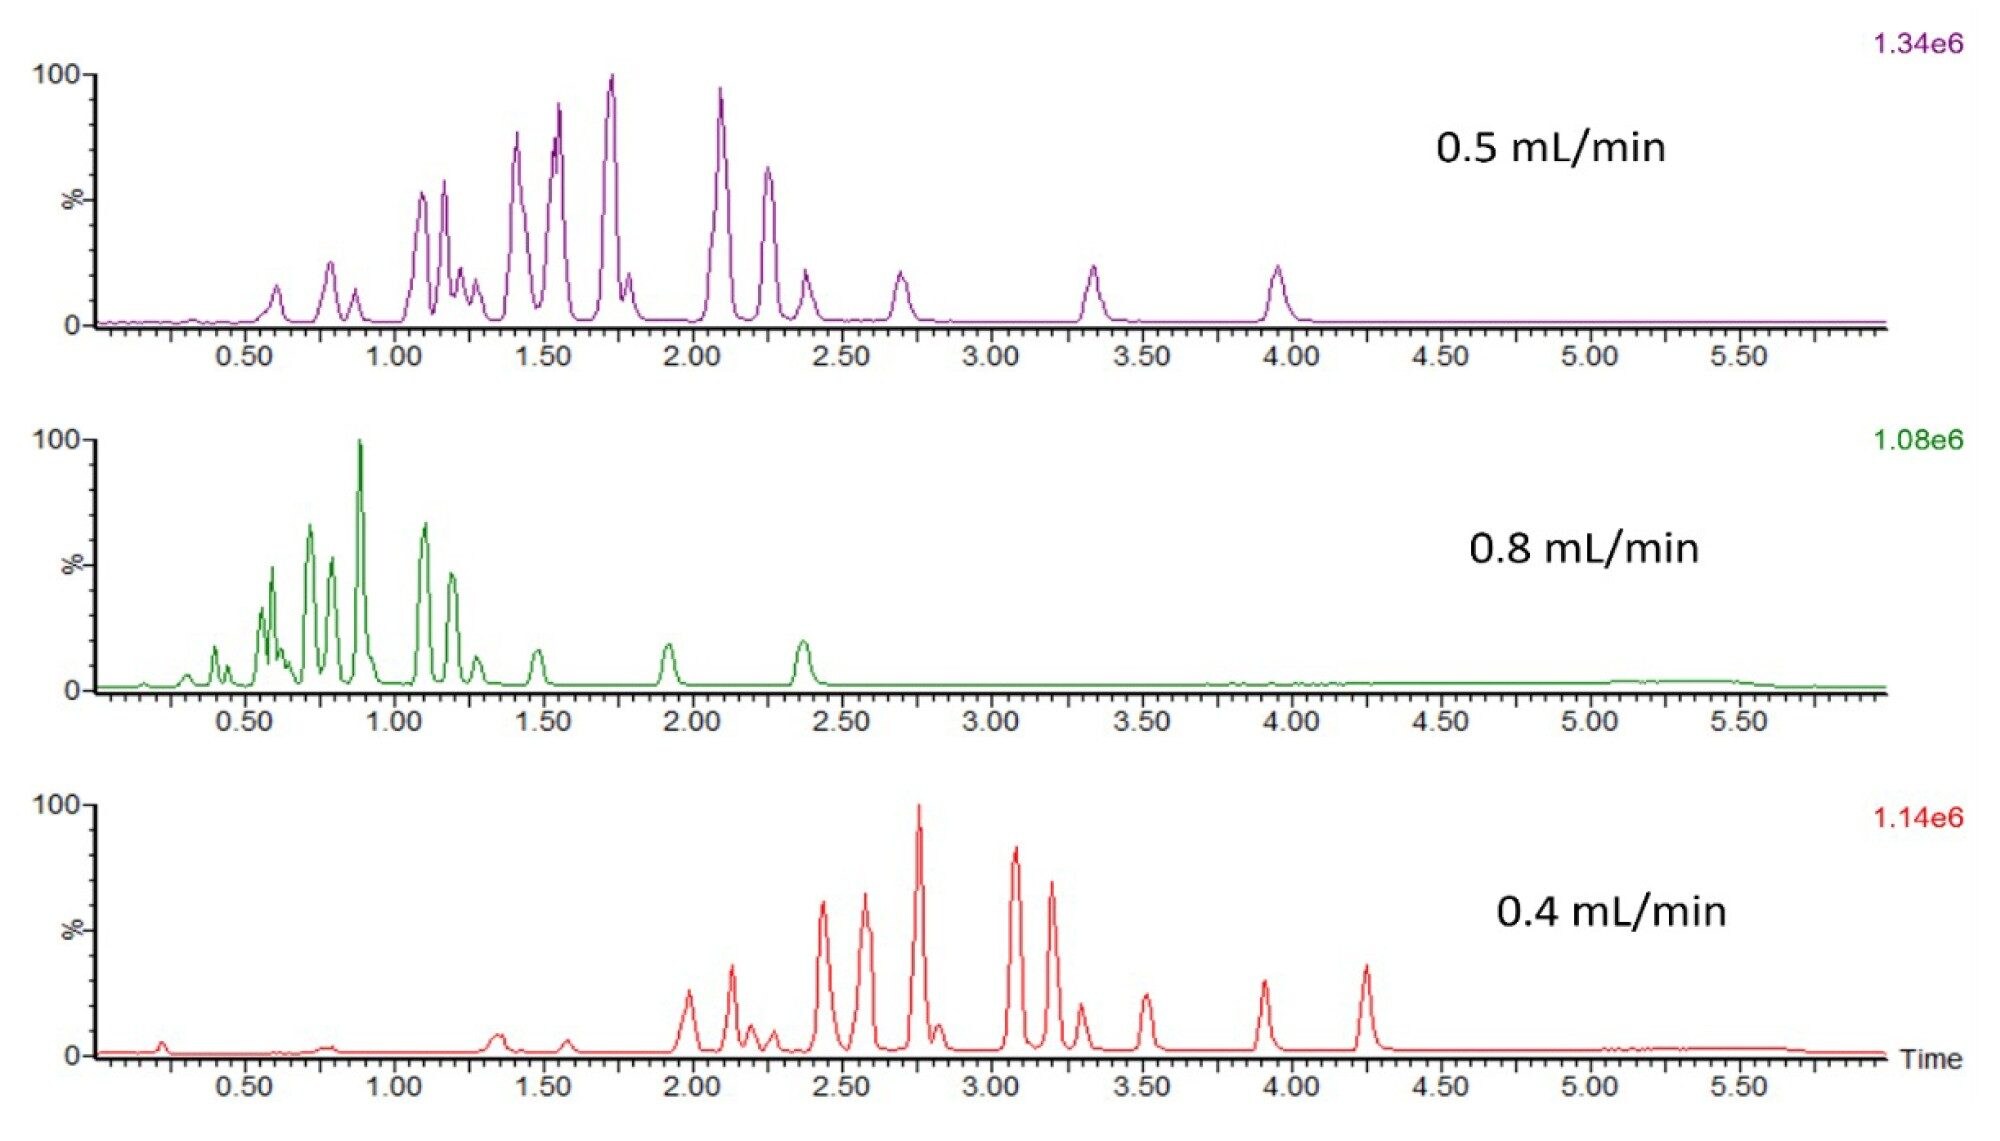 Figure 4. Effect of column flow rate on FFA peaks separation. The FFA standard on-column amount was 10 ng for each injection.
High organic conditions were needed to elute FFA off the LC column. Hence, to obtain peaks for early eluting components i.e., C8:0 to C12:0, high organic starting conditions (55% mobile phase B) were selected.
Upon elevating mobile phase B% from 55% to 90%, a fast elution of all compounds from the column was observed in under a minute. In contrast, a more gradual gradient transition to 80% from 55% yielded favorable results, evident in well-resolved peaks (Figure 5). This optimized peak separation facilitated the application of the Single Ion Recording (SIR) acquisition mode to individual FFAs within the mixture. The implementation involved splitting the acquisition method into five discrete SIR timed windows, each encompassing three to five distinct FFA components.
The selection of the SIR acquisition extended the duration spent on each component, leading to improved peak responses and separation. Consequently, this led to a reduction in the signal-to-noise (S/N) ratio, resulting in enhanced sensitivity, and an increase in response repeatability, illustrated in Figure 6.
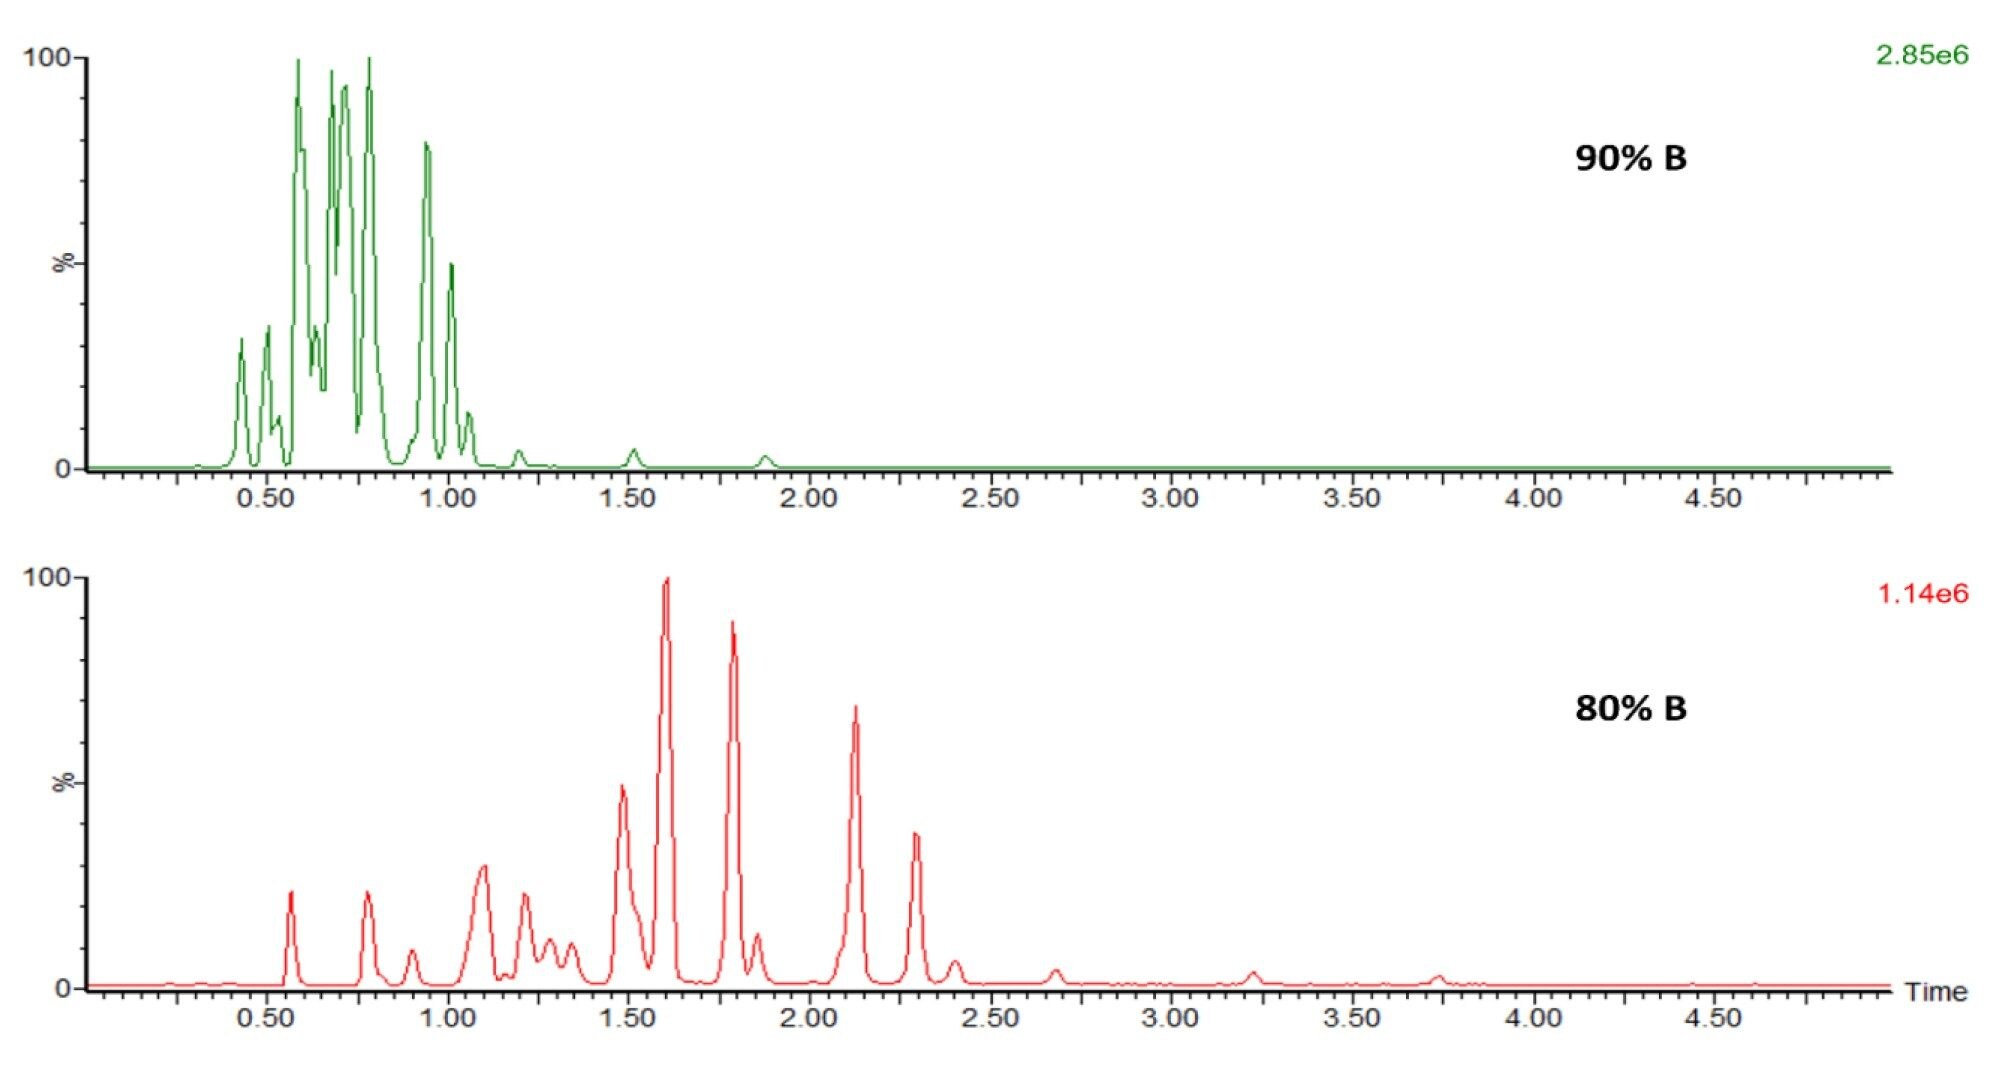 Figure 5. High and gradual organic gradient is required for peak separation of the FFA standard mix. The FFA standard on-column amount was 10 ng and 5 ng for top and bottom injections, respectively.
Figure 6 shows a chromatogram representing the final LC-MS method selected for FFAs analysis. Upon evaluating a range of method development factors, 1 mM aqueous NH4HCO4 and ACN were established as mobile phases A and B, respectively, and were used at B%; 55% to 80 on a phenyl BEH column (Table 1 and 2).
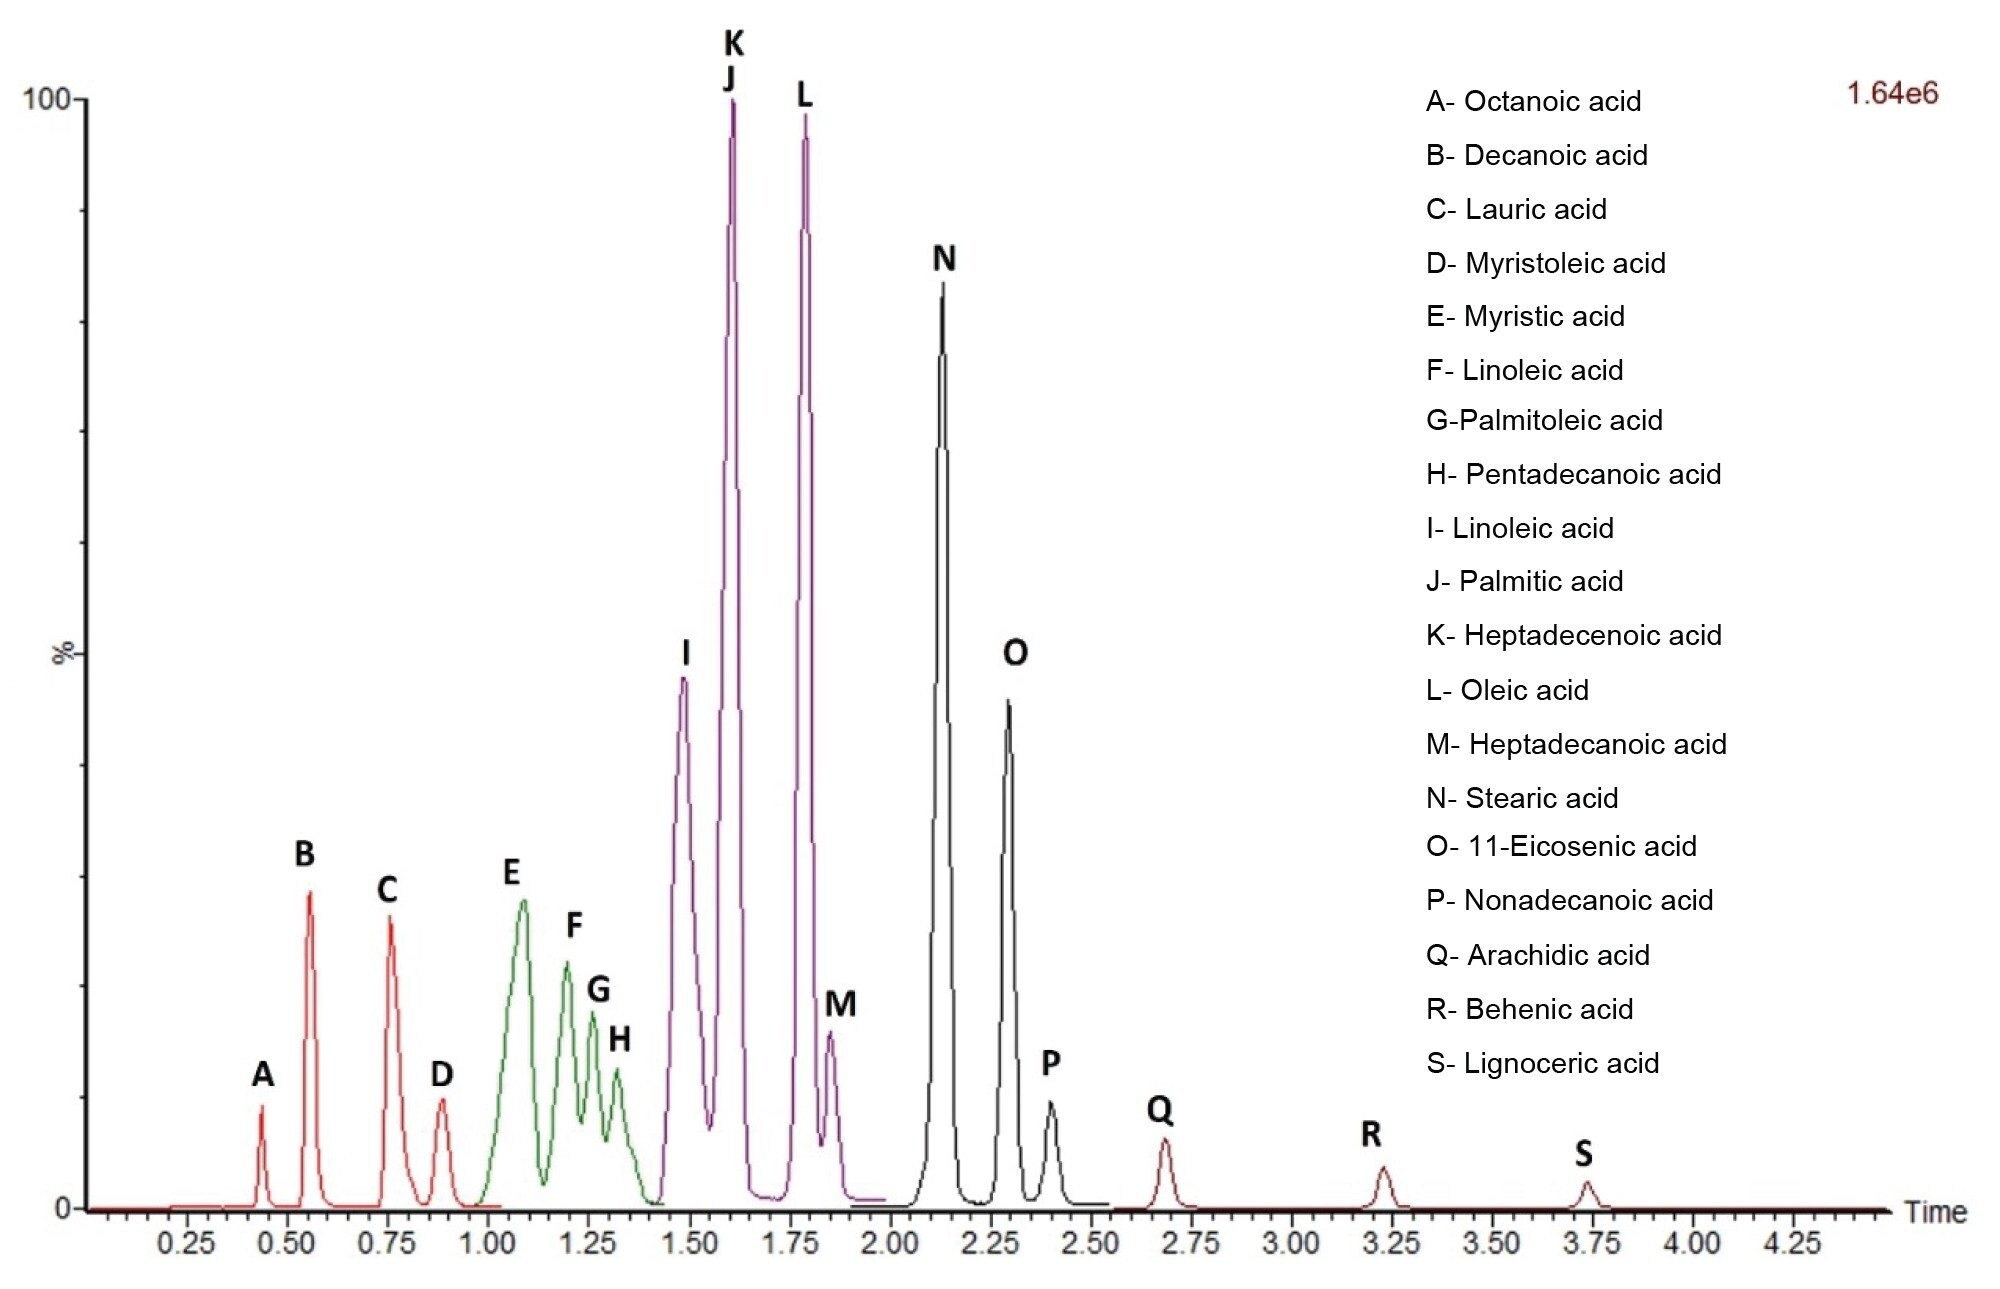 Figure 6. SIR acquisition using five distinct timed windows containing all 19 targeted FFAs. Each SIR window and FFA peaks are highlighted by different colors and letters.
Sensitivity and Repeatability Assessment
Furthermore, this method proved to be highly sensitive to levels below 10 pg/µL for all FFAs components and reproducible at high and low concentrations with % RSD between 0.3–8.2% for all components.
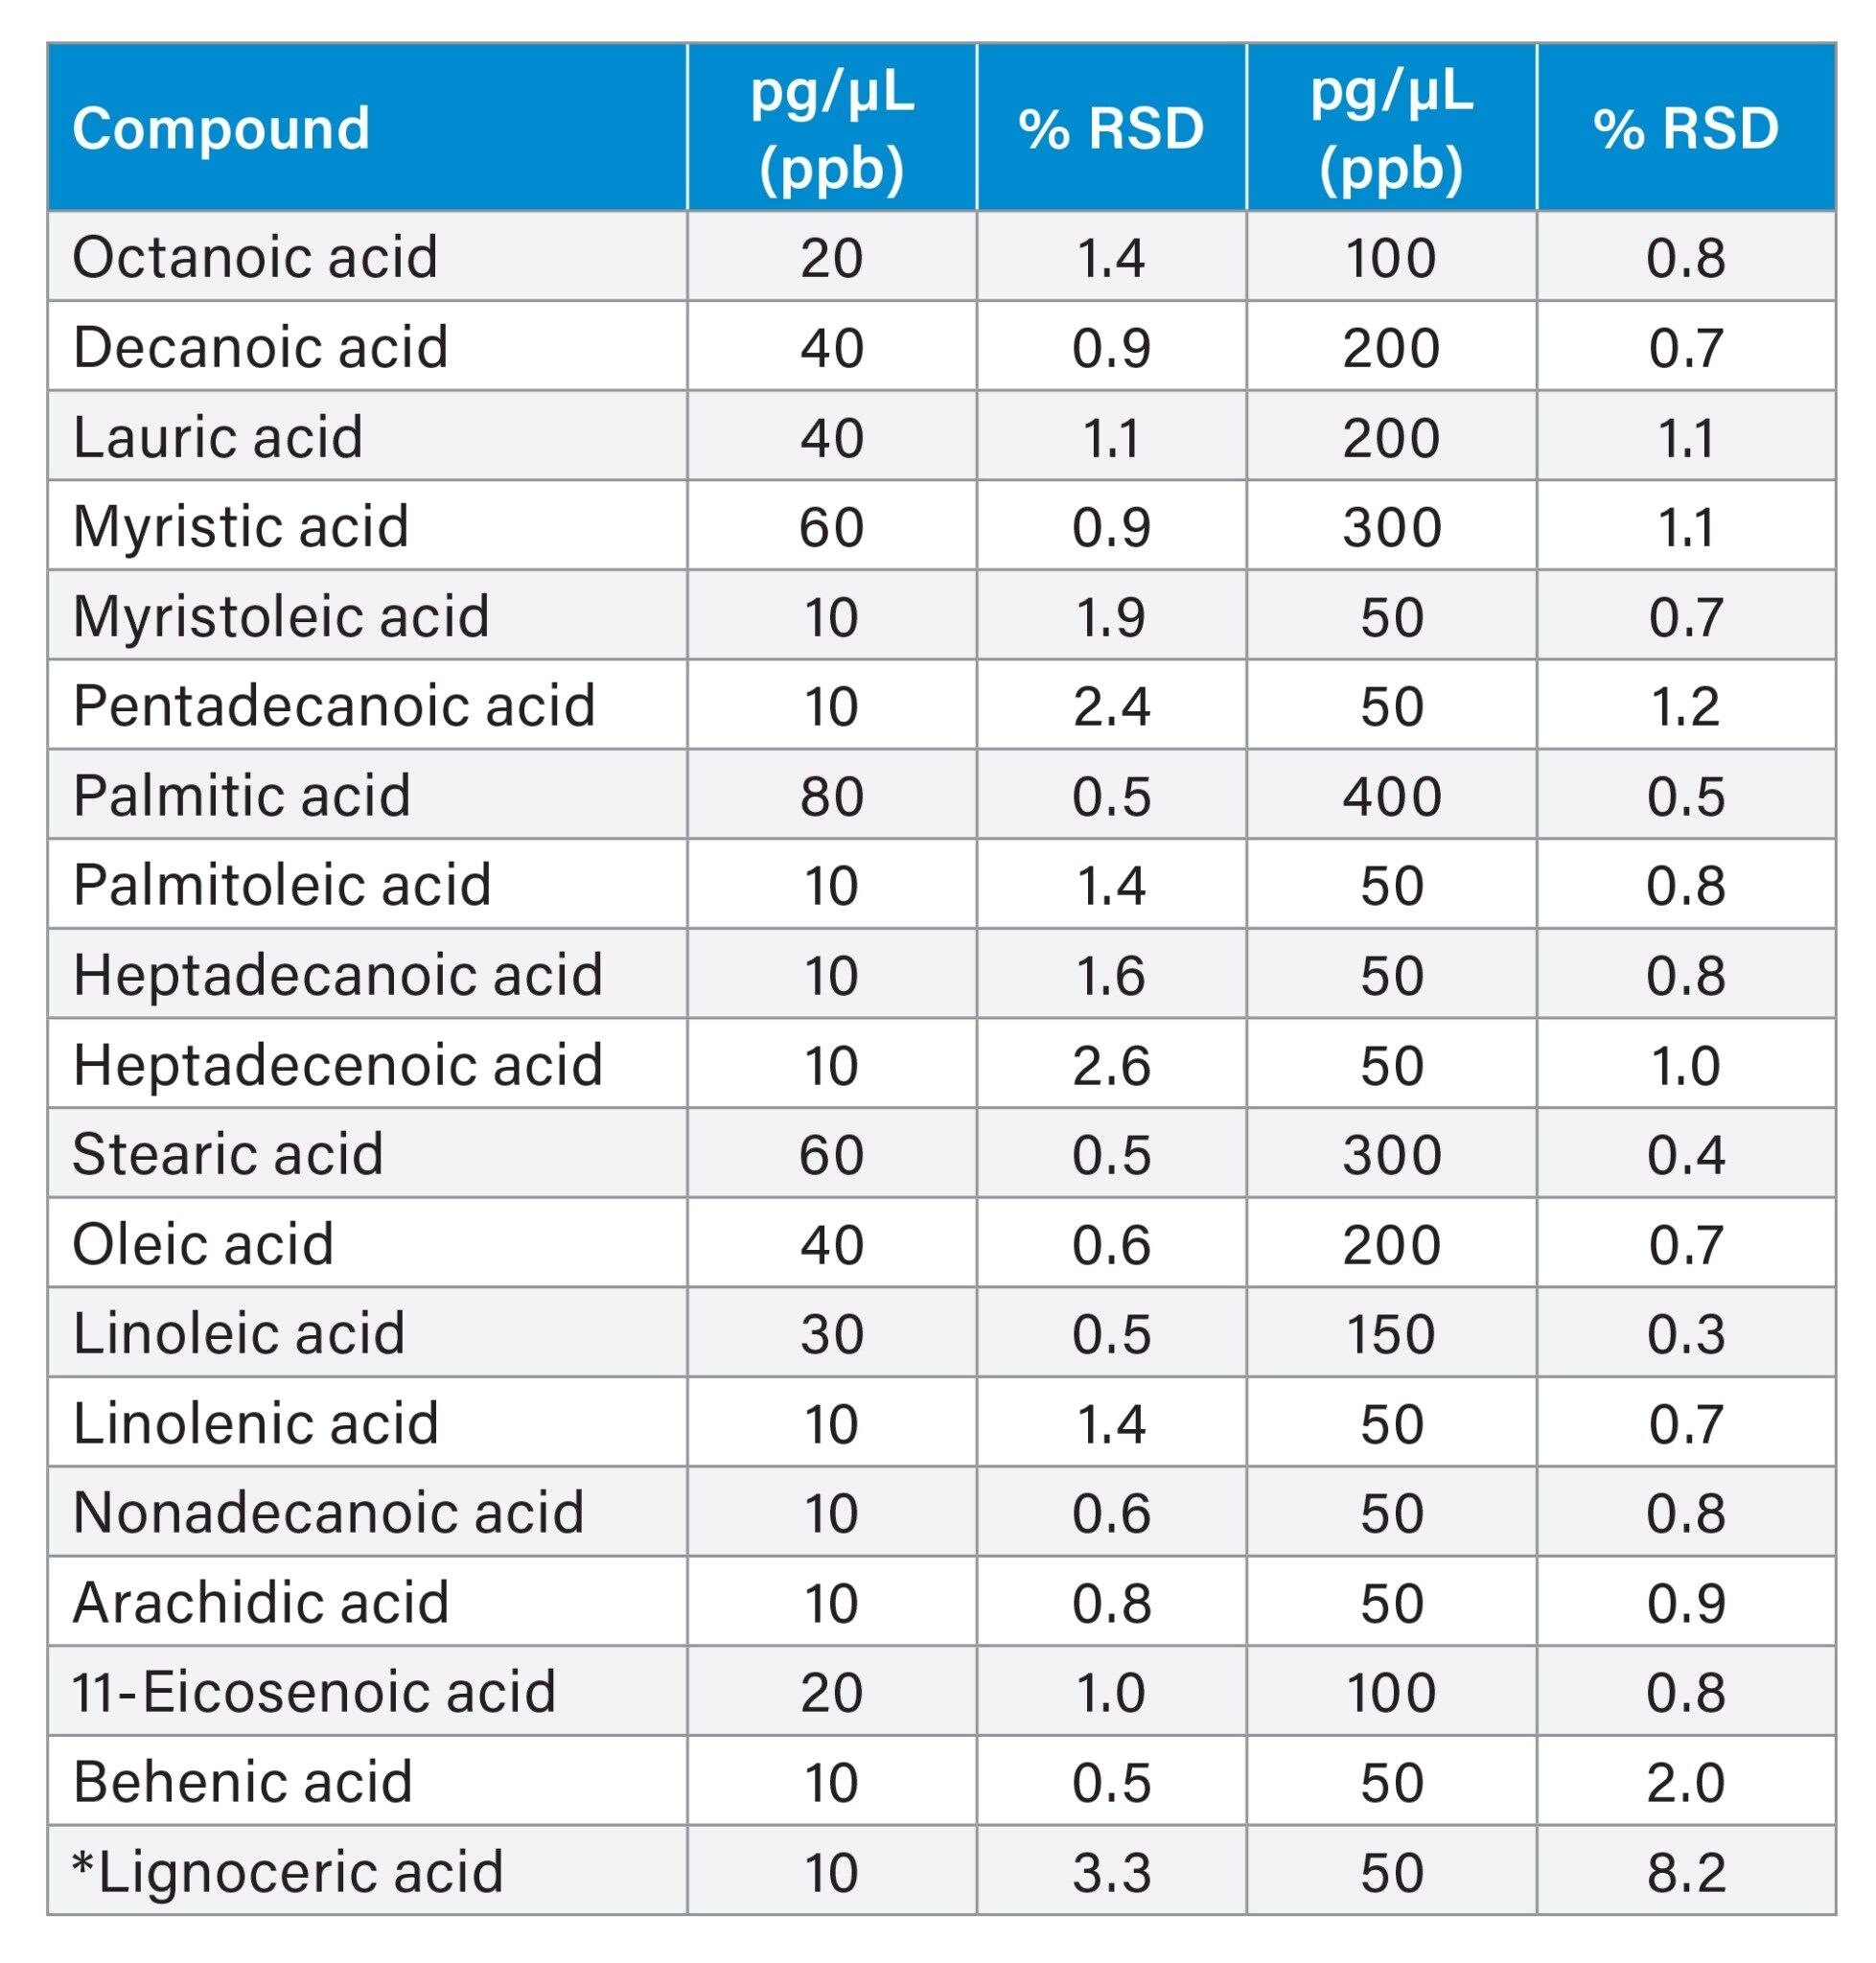 Table 6. Repeatability data of 19 FFAs components in the standard mix. Differences in ppb concentration reflect relative percentage% abundance in the standard mix. *High %RSD of lignoceric acid can be explained by increase in chemical noise towards the end of the run.
The lower limit of quantification (LLOQ) was determined at 20:1 S/N root mean square (RMS) and five times peak area compared to blank response.
 Table 7. LLOQ of 19 FFA components in the mix. *Peak interference observed at stearic acid.
Preliminary Method Validation with Matrix Samples
To assess the suitability of this method, an evaluation with selected matrix samples was performed (Figure 7). FFAs from cow milk and infant formula samples were extracted from using a simple MeOH extraction and a further diluted in 1:1 mobile phase A and B before LC-MS analysis. Although FFAs make up less than 2% of fats in milk and infant formula, the concentrations of FFAs detected in the samples analyzed matched manufacturer and literature reported levels.5,6
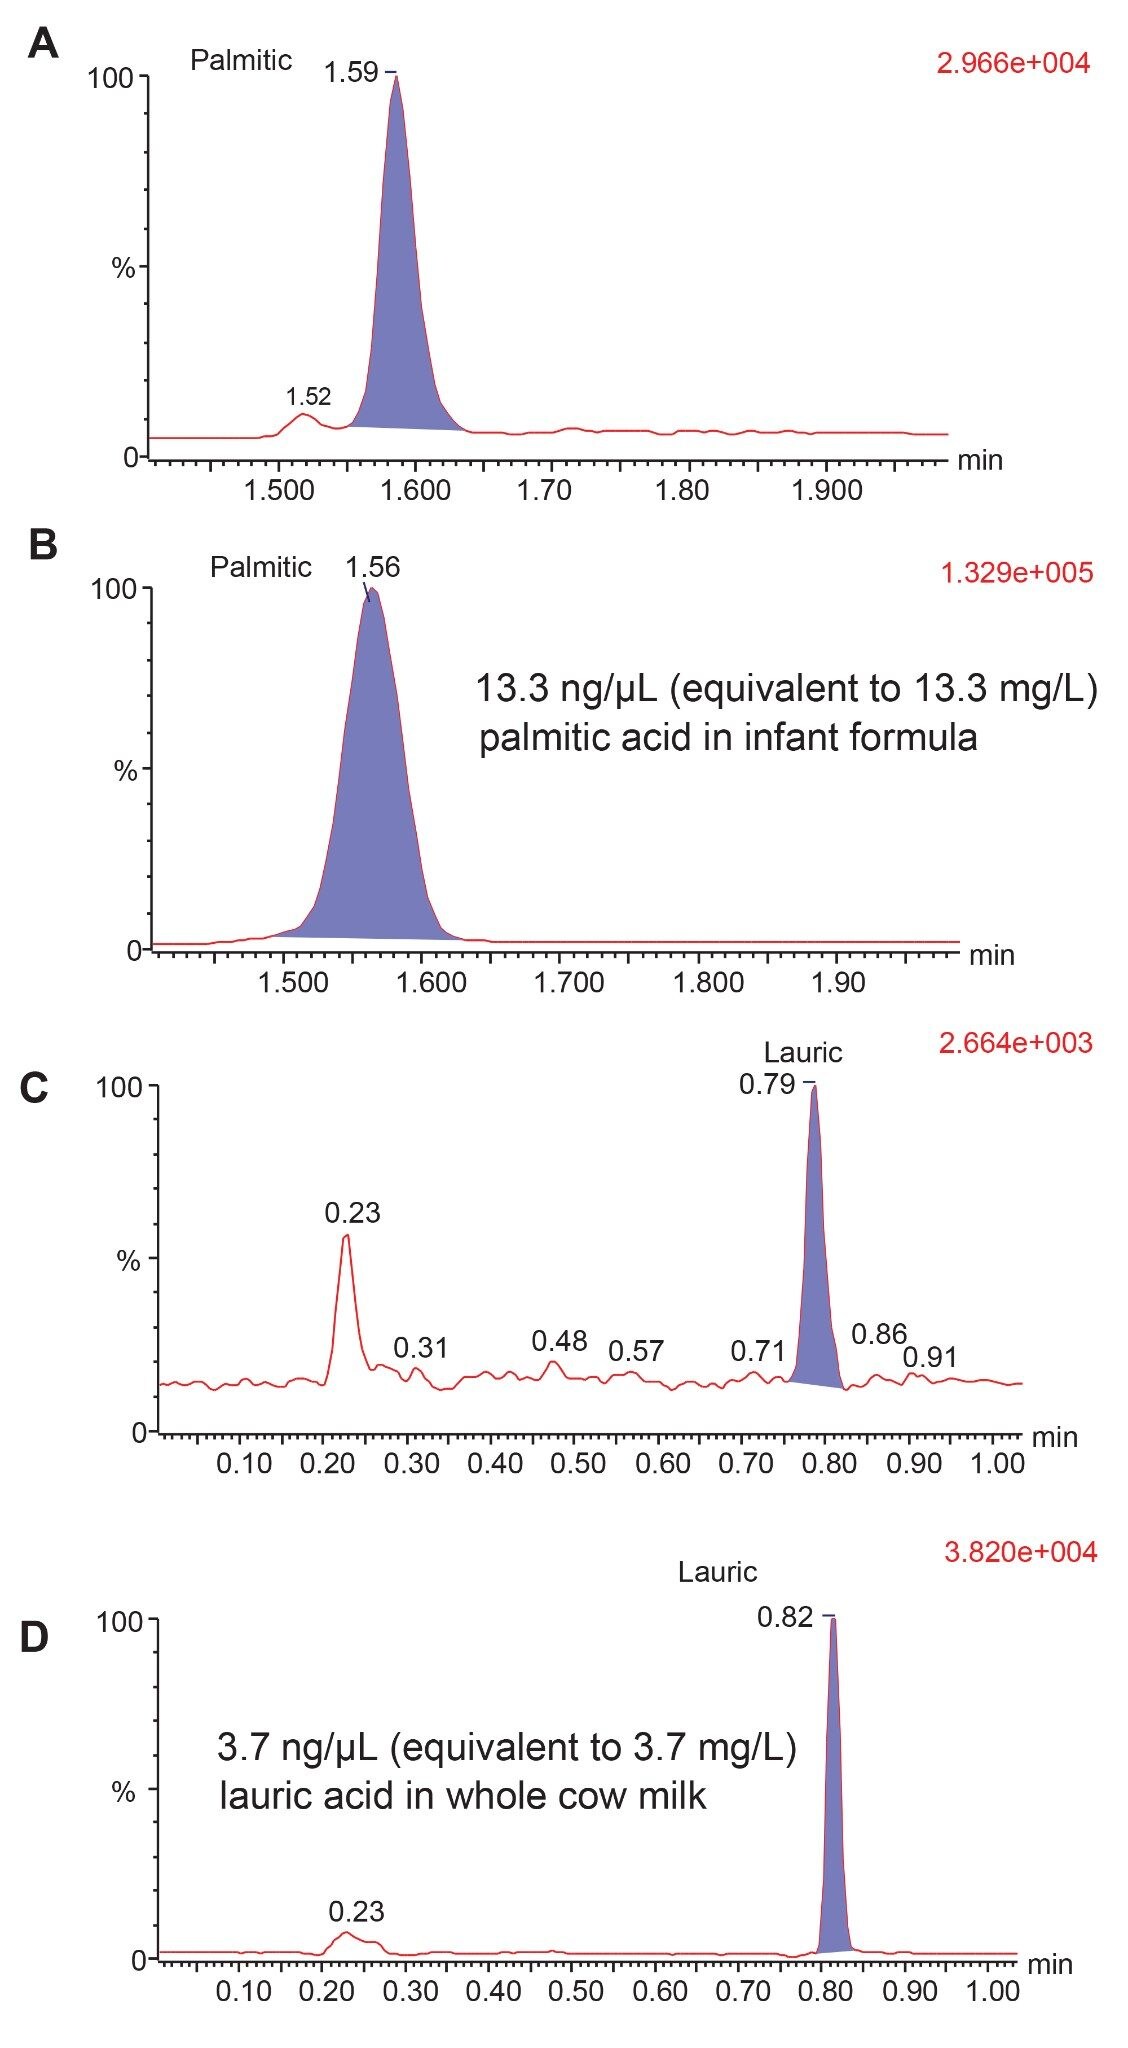 Figure 7. Example of method performance with real samples. A) Palmitic acid at 1.6 pg/µL in standard mix; B) palmitic acid at 13.3 ng/µL in infant formula; C) Lauric acid at 4 pg/µL in standard mix; D) lauric acid at 3.7 ng/µL in whole milk.
This method demonstrated its suitability for fast, high sample throughput analysis (up to 240 samples per day) of FFAs, however, reliable linearity i.e., R2≥0.99 is yet to be demonstrated to perform quantification studies.
Conclusion
In conclusion, the implementation of a new innovative analytical method utilizing ACQUITY I-Class UPLC coupled to ACQUITY QDa II Mass Detector, along with the ACQUITY UPLC BEH Phenyl Column, demonstrates clear advantages for free fatty acids analysis.
This method not only ensures swift and accurate separation of a wide range of FFAs, spanning from C8:0 to C24:0, in less than six minutes, but also offers potential substantial benefits to laboratories such as significant cost savings, while simultaneously minimizing complex procedural steps.
Moreover, the considerable time-saving potential of this method (as compared to typical GC-MS analysis which typically takes 20 minutes to one hour per sample) allows researchers to enhance productivity and throughput, contributing to more efficient laboratory operations.
Overall, the combination of speed, sensitivity, and simplicity in this analytical approach has the potential for a substantial leap forward in routine FFAs analysis, underscoring its value as an important tool for laboratories performing this analysis.
References
- Significance of Lipolysis in the Manufacture and Storage of Dairy Products. IDF Bulletin No. 144. Brussels, Belgium: International Dairy Federation. IDF (1987).
- Clarke, H. J., McCarthy, W. P., O'Sullivan, M. G., Kerry, J. P., and Kilcawley, K. N., Oxidative Quality of Dairy Powders: Influencing Factors and Analysis. Foods (Basel, Switzerland), 2021. 10, 2315.
https://doi.org/10.3390/foods10102315. - Imamura, F., Fretts, A., Marklund, M., Ardisson Korat, A. V., Yang, W. S., Lankinen, M., Qureshi, W., Helmer, C., Chen, T. A., Wong, K., Bassett, J. K., Murphy, R., Tintle, N., Yu, C. I., Brouwer, I. A., Chien, K. L., Frazier-Wood, A. C., Del Gobbo, L. C., Djoussé, L., Geleijnse, J. M., Fatty Acids and Outcomes Research Consortium (FORCE). Fatty Acid Biomarkers of Dairy Fat Consumption and Incidence of Type 2 Diabetes: A Pooled Analysis of Prospective Cohort Studies. PLoS medicine, 15, e1002670. 2018. https://doi.org/10.1371/journal.pmed.1002670.
- de Oliveira Otto, M. C., Lemaitre, R. N., Song, X., King, I. B., Siscovick, D. S., Mozaffarian, D.,2018. Serial Measures of Circulating Biomarkers of Dairy Fat and Total and Cause-Specific Mortality in Older Adults: the Cardiovascular Health Study. The American journal of clinical nutrition, 108, 476–484. https://doi.org/10.1093/ajcn/nqy117.
- Pilar Gómez-Cortés, Manuela Juárez, Miguel Angel de la Fuente, 2018. Milk Fatty Acids and Potential Health Benefits: An Updated Vision. Trends in Food Science & Technology, 81, 1–9. https://doi.org/10.1016/j.tifs.2018.08.014.
- Kokotou, M. G., Mantzourani, C., & Kokotos, G., Development of a Liquid Chromatography-High Resolution Mass Spectrometry Method for the Determination of Free Fatty Acids in Milk. Molecules (Basel, Switzerland). 2020, 25, 1548. https://doi.org/10.3390/molecules25071548.
720008134, January 2024