• Application Note

Developing High Resolution HILIC Separations of Intact Glycosylated Proteins Using a Wide-Pore Amide-Bonded Stationary Phase

Developing High Resolution HILIC Separations of Intact Glycosylated Proteins Using a Wide-Pore Amide-Bonded Stationary Phase

  • Matthew A. Lauber
  • Scott A. McCall
  • Bonnie A. Alden
  • Pamela C. Iraneta
  • Stephan M. Koza
  • Waters Corporation

Abstract

Hydrophilic interaction chromatography (HILIC) has been widely adopted as a tool for separating highly polar compounds, and it has become a common technique for small molecule separations. In contrast, use of HILIC for large biomolecules has been comparatively limited even though there are instances in which the selectivity of HILIC would be highly valuable, for example, during the characterization of protein glycosylation.

A typical approach to the analysis of glycans involves their enzymatic or chemical release from the protein followed by chromatographic separation by HILIC. UPLC-based separations, founded on an optimized sub-2-µm amide-bonded stationary phase has transformed HILIC separations of released glycans by facilitating faster, high-resolution separations.

To enable the analysis of glycans that are still attached to the protein, we present in this application note an optimized HILIC column and corresponding methods for resolving the glycoforms of intact and digested glycoproteins ranging in mass from 10 to 150 kDa. A wide-pore (300Å) amide-bonded, organosilica (ethylene bridged hybrid, or BEH) stationary phase is employed.

Just as reversed-phase separations are employed for resolving protein isoforms that have varying hydrophobicities, we demonstrate that HILIC separations with BEH Amide 300Å can be used for resolving protein isoforms that exhibit varying hydrophilicities, such as isoforms differing with respect to glycan occupancy.

With the availability of these new separation capabilities, it will be possible to perform more detailed characterization of intact glycoproteins, whether by means of combining HILIC with optical detection or with ESI-MS.

Benefits

  • Improved HILIC separations of intact protein glycoforms through optimization of stationary phase (bonded phase and pore size), ion pairing, column pressurization, and injection approaches.
  • MS-compatible HILIC to enable detailed investigations of sample constituents.
  • Orthogonal selectivity to conventional reversed-phase (RP) separations for enhanced characterization of glycoprotein samples.
  • Glycoprotein BEH Amide, 300Å, 1.7 μm stationary phase is QC tested via a glycoprotein separation to ensure consistent batch to batch reproducibility.

Introduction

Hydrophilic interaction chromatography (HILIC) has been widely adopted as a tool for separating highly polar compounds. In fact, it has become a relatively widespread technique for small molecule separations. By comparison, the application of HILIC to large biomolecules has been comparatively limited even though there are instances in which the separation selectivity of HILIC would be highly valuable, for example during the characterization of protein glycosylation. A standard approach to the analysis of glycans involves their enzymatic or chemical release from their counterpart protein followed by their chromatographic separation using HILIC. UPLC-based separations founded upon an optimized, sub-2-µm amide-bonded stationary phase has transformed HILIC separations of released glycans by facilitating faster, higher resolution separations.1-2 Although released glycan analysis is a gold-standard approach, it has historically required lengthy and at times cumbersome sample preparation techniques. And while the recent introduction of the GlycoWorks RapiFluor-MS N-Glycan Kit alleviates many of these shortcomings,3 alternative means of characterizing protein glycosylation must sometimes be investigated,4-6 for instance when it is of interest to elucidate sites of modification.7

To enable the complementary analysis of glycans as they are still attached to their counterpart proteins, we present an optimized HILIC stationary phase and corresponding methods for resolving the glycoforms of intact and digested glycoproteins. A wide-pore (300Å) amide-bonded, organosilica (ethylene bridged hybrid; BEH)8 stationary phase is employed along with rigorously developed methods to achieve unprecedented separations of the glycoforms of intact proteins ranging in mass from 10 to 150 kDa. 

Experimental

Sample description

Glycoprotein Performance Test Standard (a formulation of bovine RNase A and RNase B, p/n 186008010) and RNase B (Sigma R7884) were reconstituted in 18.2 MΩ water to a concentration  of 2 mg/mL. Trastuzumab was diluted with water from its formulated concentration of 21 mg/mL to a concentration of 2 mg/mL. 

For column conditioning, the components of a vial of Glycoprotein Performance Test Standard (100 µg) were dissolved in 25 µL of 0.1% trifluoroacetic acid (TFA), 80% acetonitrile (ACN) to create  a 4 mg/mL protein solution.

To investigate the resolution of glycan occupancy isoforms, Intact mAb Mass Check Standard (p/n 186006552) was deglycosylated using the following techniques. The glycoprotein (15 µg) was reconstituted to a concentration of 0.52 mg/mL into a 28.2 μL solution of 1% (w/v) RapiGest SF Surfactant and 50 mM HEPES (pH 7.9). This solution was heated to 90 °C over 3 minutes, allowed to cool to 50 °C, and mixed with 1.2 μL of GlycoWorks Rapid PNGase F solution. Deglycosylation was completed by incubating the samples at 50 °C for 5 minutes. To produce partial deglycosylation, Intact mAb Mass Check Standard was deglycosylated using only a 5 minute, 50 °C incubation with PNGase F without a heat-assisted pre-denaturation.

Method conditions (unless otherwise noted)

Column conditioning

New (previously unused) ACQUITY UPLC Glycoprotein BEH Amide, 300Å, 1.7 µm Columns should be conditioned, before actual test sample analyses, via two sequential injections and separations of 40 µg Glycoprotein Performance Test Standard (10 µL injections of 4 mg/mL in 0.1% TFA, 80% ACN) or with equivalent loads of a test sample for which the column has been acquired. The separation outlined in Figure 2 can be employed for conditioning with the Glycoprotein Performance Test Standard. 

LC conditions

LC system:

ACQUITY UPLC H-Class Bio System

Sample temp.:

5 °C

Analytical column temp.:

30 °C (unless noted otherwise in the caption)

UV detection:

214/280 nm, 2 Hz

Fluorescence detection:

Ex 280/Em 320 nm, 10 Hz

Flow rate:

0.2 mL/min

Injection volume:

≤1 μL (aqueous diluents). Note: It might be necessary to avoid high organic diluents for some samples due to the propensity for proteins to precipitate under ambient conditions. A 2.1 mm I.D. column can accommodate up to a 1.2 μL aqueous injection before chromatographic performance is negatively affected.

Columns:

ACQUITY UPLC Glycoprotein BEH Amide, 300Å, 1.7 μm, 2.1 x 150 mm, with Glycoprotein Performance Test Standard);

ACQUITY UPLC Glycoprotein BEH Amide 300Å, 1.7 μm, 2.1 x 100 mm, with Glycoprotein Performance Test Standard);

ACQUITY UPLC BEH HILIC, 130Å, 1.7 μm, 2.1 x 150 mm;

XBridge BEH HILIC, 130Å, 5 μm, 2.1 x 150 mm;

ACQUITY UPLC Glycan BEH Amide, 130Å, 1.7 μm, 2.1 x 150 mm;

ACQUITY UPLC Glycan BEH Amide, 130Å, 1.7 μm, 2.1 x 100 mm

Competitor columns:

PolyHYDROXYETHYL A, 300Å, 3 μm, 2.1 x 100 mm;

Glycoplex  A, 3 μm, 2.1 x 100 mm; ZORBAX.  RRHD 300-HILIC, 300Å, 1.8 μm, 2.1 x 100 mm;

Halo PentaHILIC, 90Å, 2.7 μm, 2.1 x 100 mm;

SeQuant ZIC-HILIC, 200Å, 3.5 μm, 2.1 x 100 mm;

Accucore Amide, 150Å, 2.6 μm, 2.1 x 100 mm;

TSKgel  Amide-80, 80Å, 3 μm, 2.0 x 100 mm

Column connector (for coupling 150 mm columns):

0.005 x 1.75 mm UPLC SEC Connection Tubing

Vials:

Polypropylene 12 x 32 mm, 300 μL

Screw Neck Vial

Gradient used to demonstrate the progression of HILIC separation technologies (Figure 1):

Column dimension: 

2.1 x 150 mm

Mobile phase A:

0.1% (v/v) TFA, water

Mobile phase B:

0.1% (v/v) TFA, ACN

Time (min)

%A

%B

Curve

0

20

80

6

20

80

20

6

21

20

80

6

30

20

80

6

Focused gradient for RNase B HILIC separations (Figures 2 and 5)

Column dimension: 

2.1 x 150 mm

Mobile phase A:

0.1% (v/v) TFA, water

Mobile phase B:

0.1% (v/v) TFA, ACN

Time (min)

%A

%B

Curve

0

20

80

6

1

34

66

6

21

41

59

6

22

100

0

6

24

100

0

6

25

20

80

6

35

20

80

6

Gradient for benchmarking/evaluations (Figure 3)

Column dimension: 

2.1 x 150 mm

Mobile phase A:

0.1% (v/v) TFA, water

Mobile phase B:

0.1% (v/v) TFA, ACN

Time (min)

%A

%B

Curve

0.0

20

80

6

0.7

30

70

6

29.3

45

55

6

30.0

80

20

6

31.3

80

20

6

32.0

20

80

6

40.0

20

80

6

Gradient employed to select a mobile phase additive (Figure 4):

Column dimension: 

2.1 x 150 mm

Mobile phase A:

0.1% (v/v) TFA, water or 50 mM ammonium formate, pH 4.4 or 0.5% (w/v) formic acid, water

Mobile phase B:

ACN

Time (min)

%A

%B

Curve

0

20

80

6

20

80

20

6

21

20

80

6

30

20

80

6

Focused gradient for reversed phase of RNase B (Figure 6):

Column dimension: 

2.1 x 150 mm

Mobile phase A:

0.1% (v/v) TFA, water

Mobile phase B:

0.1% (v/v) TFA, ACN

Time (min)

%A

%B

Curve

0

95

5

6

1

74.5

25.5

6

21

67.5

32.5

6

22

10

90

6

24

10

90

6

25

95

5

6

35

95

5

6

Focused gradient for intact trastuzumab (Figures 7 and 8)

Column dimension: 

2.1 x 150 mm, with varying lengths

25 μm I.D. PEEK post-column tubing

Or two coupled 2.1 x 150 mm columns

Mobile phase A:

0.1% (v/v) TFA, water

Mobile phase B:

0.1% (v/v) TFA, CAN

Time (min)

%A

%B

Curve

0

20

80

6

1

30

70

6

21

37

63

6

22

70

30

6

24

70

30

6

25

20

80

6

45

20

80

6

Conditions for resolving glycan occupancy isoforms of an IgG (Figure 9):

Column dimension: 

Two coupled 2.1 x 150 mm or a single 2.1 x 150 mm

Column Temp.:

80 °C

Mobile phase A:

0.1% TFA, 0.3% HFIP in water

Mobile phase B:

0.1% TFA, 0.3% HFIP in CAN

Time (min)

%A

%B

Curve

0

20

80

6

10

50

50

6

11

100

0

6

14

100

0

6

15

20

80

6

25

20

80

6

MS conditions

MS system: 

Xevo G2 QTof

Ionization mode:

ESI+

Analyzer mode:

Resolution (~20 K)

Capillary voltage:

3.0 kV

Cone voltage:

45 V

Source temp.:

150 °C

Desolvation temp.:

350 °C

Desolvation gas flow:

800 L/Hr

Calibration:

NaI, 2 μg/μL from 100–2000 m/z

Acquisition:

500–4000 m/z, 0.5 sec scan rate

Data management:

MassLynx. Software (v4.1)

Results and Discussion

Progression of HILIC technology for glycoprotein separations

HILIC originated in the early 1990s as a separation technique to resolve highly polar molecules using mobile phases adapted from reversed phase chromatography.9 The HILIC separation mechanism is largely believed to be dependent on a polar stationary phase that adopts an immobilized water layer.9 Hydrophilic analytes partition into this immobilized water layer and undergo interaction with the phase via a combination of hydrogen bonding, dipole-dipole, and ionic interactions. In this way, hydrophilic analytes will be retained on the HILIC phase under apolar initial mobile phase conditions and later eluted  by increasing polar mobile phase concentration via use of an LC gradient.9

Numerous HILIC or HILIC-like stationary phases have been developed in the last two decades. Many based solely on unbonded silica particles are widely available, so too are HILIC phases based on polyalcohol bondings or charge bearing surfaces, such as those with zwitterionic bondings. For the enhanced retention and selectivity of glycans, amide bonded phases have become increasingly popular. The ACQUITY UPLC Glycan BEH Amide stationary phase found in Waters Glycan Column has, for instance, found wide-spread use for high resolution released glycan separations. 

As mentioned before, HILIC has, however, not seen wide-spread use in intact large molecule applications. Concerns that high organic solvent concentrations can result in protein precipitation have most likely discouraged many from attempting to develop HILIC-based, protein separation methods. Endeavoring beyond these perceptions, we have developed a new amide-bonded stationary phase based on a wide-pore, organosilica (ethylene bridged hybrid; BEH) particle that was specifically designed to facilitate large molecule separations. It exhibits a porous network accessible to most proteins and an average pore diameter that does not impart significant peak broadening due to restricted diffusion, which can occur when protein analytes are too close in size to the average pore diameter of a stationary phase (e.g. within a factor of 3). 

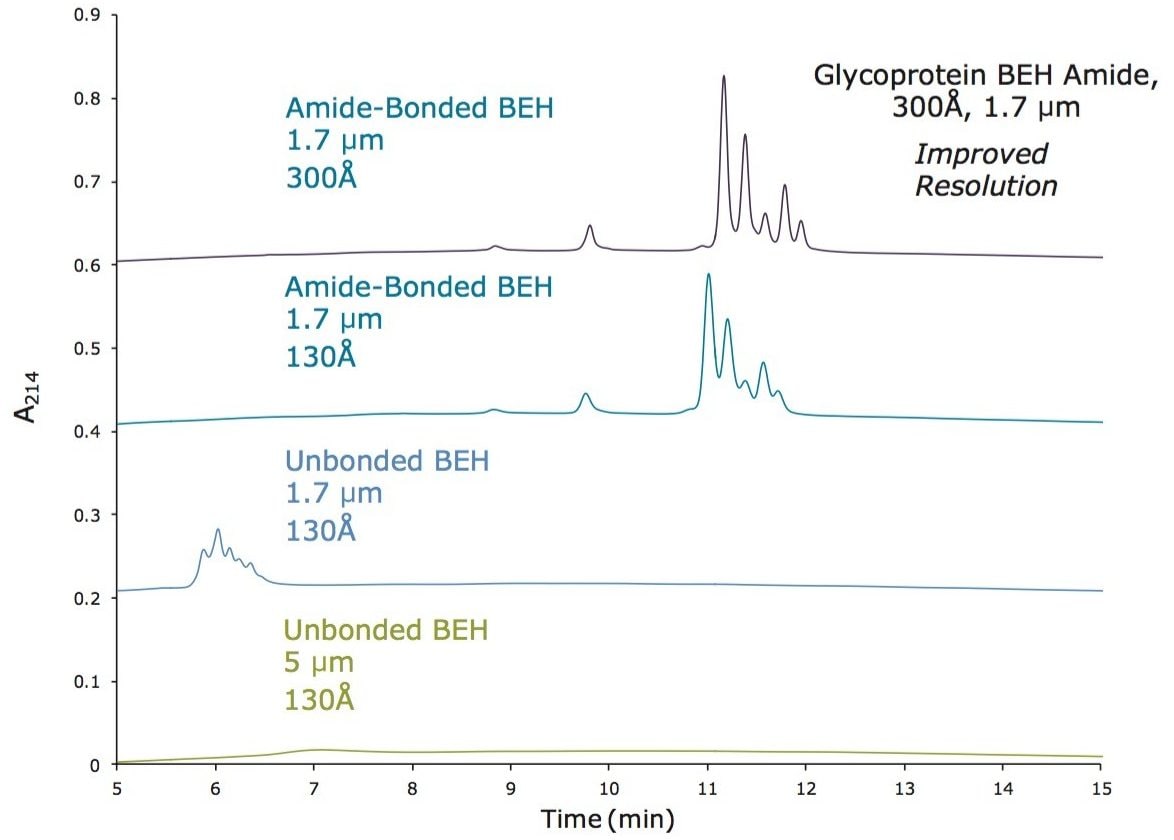
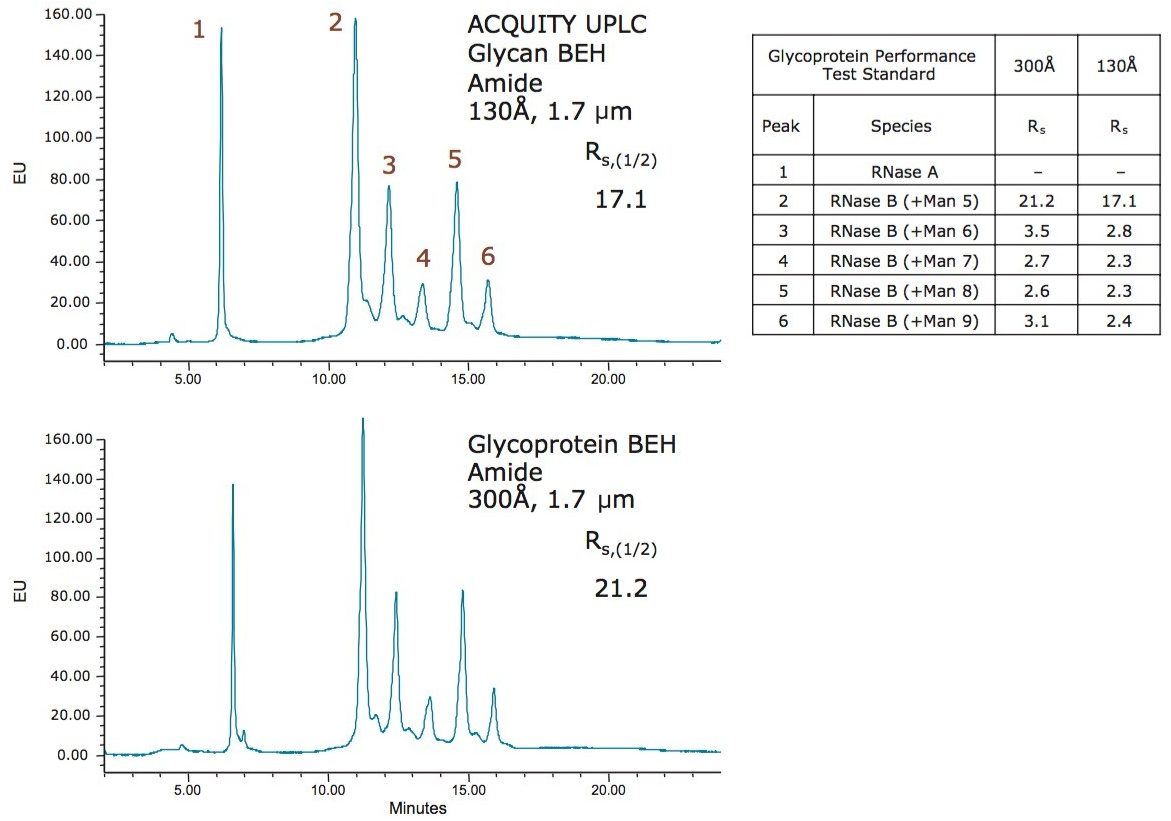
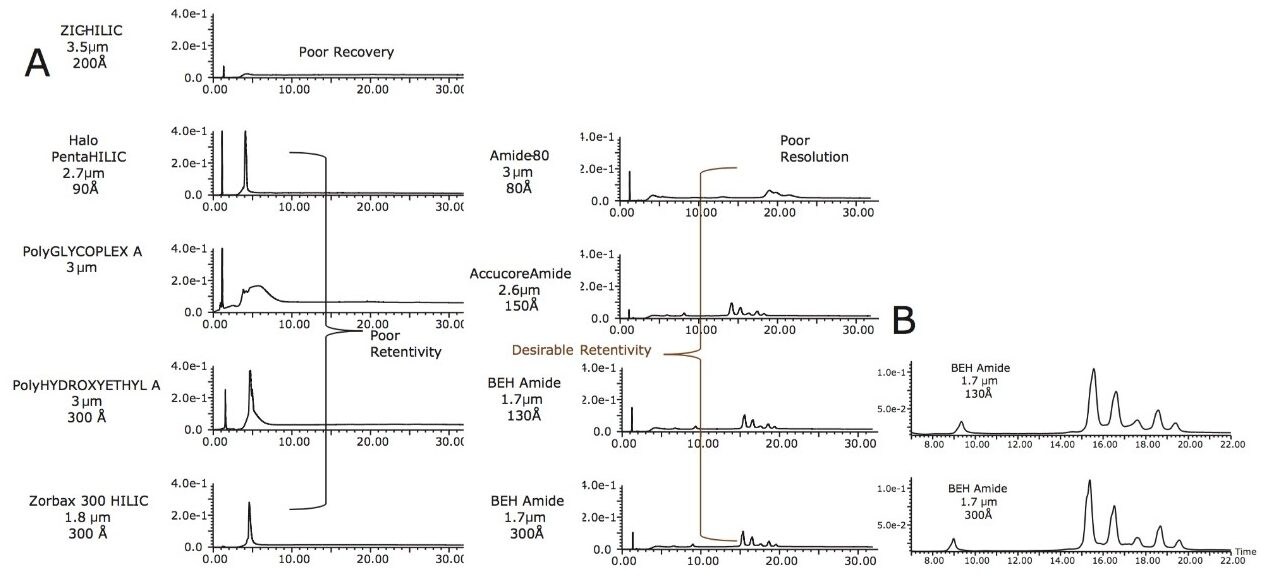
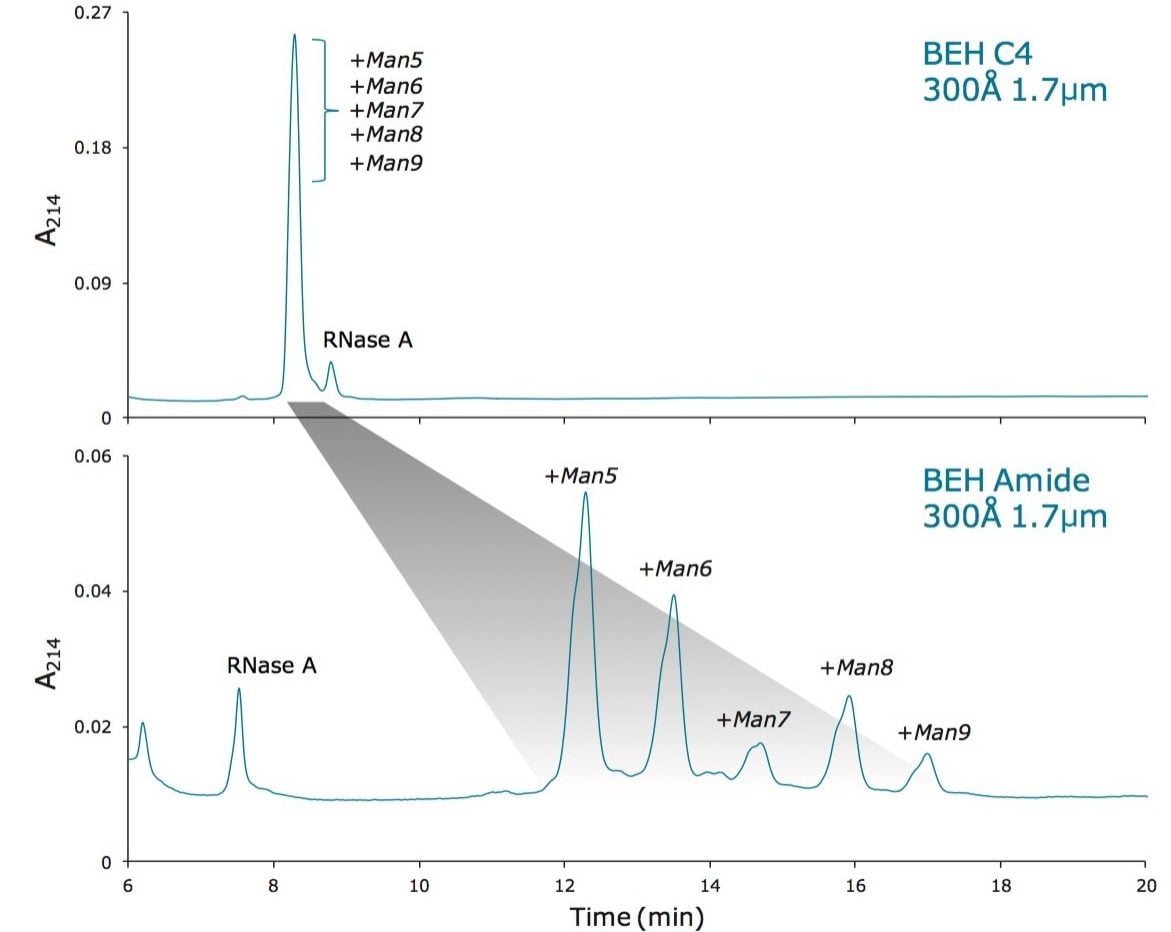
The progression of HILIC technology culminating in this new stationary phase is remarkable. The emerging technology of large molecule HILIC can be captured by separations of bovine ribonuclease B (RNase B), a 13 kDa protein comprised of several high mannose (Man5 to Man9) glycoforms. Figure 1  shows RNase B separated by several different stationary phases. From bottom to top, increasingly better separations of RNase B were achieved as increasingly newer chromatographic technologies were adopted, from 5 µm to 1.7 µm particles, from unbonded to amide bonded particles, and from standard pore diameter (130Å) to wide-pore diameter (300Å) particles. It is with BEH Amide, 300Å, 1.7 µm particles that RNase B glycoforms are best separated. The use of a wide-pore stationary phase plays a significant role in achieving optimal resolution. This is highlighted in Figure 2 wherein benchmarking results are presented from the use of a newly developed test mixture, called Glycoprotein Performance Test Standard, which contains bovine RNase B, its corresponding glycoforms and its  aglycosylated isoform (RNase A). Example separations are provided for this standard wherein  a focused gradient has been used with the wide-pore (300Å) BEH Amide as well as the standard pore size (130Å) BEH Amide stationary phase. Notice that the widepore amide column affords a measurable (24%) increase in the resolution between the aglycosylated RNase A isoform and the Man5 glycoform of RNase B, in addition to sizeable increases in resolution throughout the separation.

Figure 1. Progression of HILIC stationary-phase technologies for intact glycoprotein separations. Separation of 1 µg of RNase B using 2.1 x 150 mm columns packed with stationary phases  ranging from HPLC-size unbonded organosilica (XBridge BEH HILIC, 130Å, 5 µm) to  sub-2-µm amide-bonded organosilica 300Å, 1.7 µm particles (ACQUITY UPLC Glycoprotein  BEH Amide 300Å, 1.7 µm). 
Figure 2. Separations of the Glycoprotein Performance Test Standard (RNase A + RNase B glycoforms) using a Glycoprotein BEH Amide 300Å, 1.7 µm Column versus a BEH Amide, 130Å, 1.7 µm Column. The reported resolution values were calculated using the half-height peak widths of species 1 and 2 (RNase A and RNase B Man5 glycoforms, respectively). Fluorescence detection at Ex 280 nm and Em 320 nm and a column temperature of 45 °C were employed in this example.

The significance of these recent developments becomes more apparent when benchmarked against other commercially available HILIC phases. RNase B separations resulting from an evaluation of 10 different HILIC stationary phases are shown in Figure 3. It can be seen that 6 out of the 10 evaluated materials showed undesirable characteristics, including poor recovery and poor retention. It was only with the amide bonded stationary phases and particle technologies based on 100Å or greater pore diameters that reasonable separations of RNase B glycoforms could be achieved.

Figure 3. Evaluation of commercially available HILIC columns for intact glycoprotein separations. (A) UV chromatograms obtained for RNase B using 10 different stationary phases. (B) Zoomed HILIC UV chromatograms for the highest resolution separations.

Mobile phase optimization, MS compatibility, and orthogonality to reversed phase

High resolution HILIC separations of protein glycoforms require that mobile phase selection be given significant consideration. Most HILIC separations have been developed so as to rely on ammonium salts (formate or acetate) to mitigate significant ionic interactions and to control mobile phase pH. The suitability of such mobile phase systems to glycoproteins was evaluated using RNase B.

Figure 4 shows the corresponding RNase B chromatogram obtained when 0.1% TFA is used as the mobile phase modifier instead of 50 mM ammonium formate or 0.5% formic acid, two mobile phase compositions more frequently used for HILIC separations.2,7 It is with 0.1% TFA that glycoforms are best resolved. Along with enhancing glycoform resolution, the TFA-modified mobile phase reduced the retention of RNase B. Together these observations highlight the significance of acidic, ion pairing mobile phases to being able to achieve high resolution glycoprotein separations using HILIC. It is proposed that the acidic condition imparted by the TFA ensures that acidic residues of the protein are fully protonated and thus present in their more hydrophobic state. In addition, the ion pairing of the TFA counter ion to basic residues, ensures that cationic residues will also be separated in a more hydrophobic form. In this way, retention of a glycoprotein onto a HILIC phase is  driven primarily by the glycans and a separation more selective to resolving differences in the glycan modification is achieved.  

Figure 4. Optimization of mobile phase conditions for separations of intact and digested glycoproteins. (A) UV chromatograms obtained for RNase B when using  various mobile phases and a Glycoprotein BEH Amide, 300Å, 1.7 µm, 2.1 x 150 mm Column. (B) Schematic portraying the utility of ion pairing for glycoprotein HILIC separations. Reduced hydrophilicity imparted via ion pairing with a hydrophobic, strong acid is displayed with shading. [PDB:1RBB] 

Fortunately, TFA-modified mobile phases can be readily coupled to ESI-MS, due to their volatility. This aspect of the developed HILIC methods enables on-line characterization of the resolved glycoforms and presents a new option for profiling a sample containing glycosylated protein. To this end, the peaks resolved from RNase B using a BEH Amide, 300Å, 1.7 µm column were subjected to interrogation by ESI-MS.  

Figure 5 shows both a UV chromatogram and a corresponding total ion chromatogram (TIC) obtained when separating RNase B. By summing and deconvoluting (MaxEnt 1) the mass spectra obtained for the six labeled peaks, it was confirmed that RNase B glycoforms were being detected. In fact, the observed deconvoluted masses support identifications of aglycosylated RNase B (RNase A) along with RNase B modified by Man5 through Man9. 

Figure 5. HILIC-MS of RNase B. (A) UV (bottom) and TIC (top) chromatograms obtained for RNase B when using a focused gradient and a Glycoprotein BEH Amide, 300Å, 1.7 µm, 2.1 x 150 mm Column. (B) Deconvoluted mass spectra obtained for each labeled peak along with corresponding glycoform identifications. 

Finally, it should be pointed out that the newly developed stationary phase and the demonstrated methodologies provide new separation selectivity, one that is orthogonal and complementary to conventional reversed phase separations. Figure 6A shows that RNase B can, for instance, be separated by reversed-phase chromatography using a BEH C4, 300Å, 1.7 µm column so as to produce a high resolution separation of aglyocosylated RNAse B (RNase B) from its glycosylated isoforms. By reversed phase, however, none of high mannose glycoforms of RNase B can be resolved from one another. In contrast, a BEH Amide, 300Å, 1.7 µm column yields baseline resolution of each major glycoform (Figure 6B). 

Figure 6. Orthogonality of reversed phase with BEH C4, 300Å, 1.7 µm and HILIC with BEH Amide, 300Å, 1.7 µm Columns. (A) Separation of RNase B (1 µg) using an ACQUITY UPLC Protein BEH C4, 300Å, 1.7 µm, 2.1 x 150 mm Column. (B) Separation of RNase B (1 µg) using an ACQUITY UPLC Glycoprotein BEH Amide, 300Å, 1.7 µm, 2.1 x 150 mm Column. 

Separation of the heterogeneous glycoforms of an intact mAb

To explore the limits of this new technology, we have investigated the capabilities of resolving the glycoforms of intact mAbs. Specifically, separations of trastuzumab have been explored. These experiments required special considerations regarding sample injection, primarily because trastuzumab and numerous other glycoproteins are not readily soluble in high organic concentrations. In fact, 70–80% ACN is generally a solution condition that initiates the precipitation of proteins, such as an IgG. Accordingly, conditions for the optimal injection of aqueous diluents were developed. It has been found that a 2.1 mm I.D. column can accommodate an injection of aqueous sample up to 1 µL. From a 2 mg/mL aqueous sample of trastuzumab, appropriate sample mass loads could thus be injected and HILIC separations of the IgG could be performed. It should be mentioned that high ACN diluents can be used in intact protein HILIC, but care must be taken to enhance the solubility of the protein sample through either the use of TFA ion pairing at concentrations between 0.2–1.0%, the combined application of TFA and hexafluoroisopropanol (HFIP), or by use of co-solvents, such as dimethylsulfoxide (DMSO) (data not shown).

As shown in Figure 7, trastuzumab can indeed be separated into multiple chromatographic peaks using a BEH Amide, 300Å, 1.7 µm column and an injection from a simple 100% aqueous diluent. However, at the backpressures produced from just a 150 mm length column, a noticeably tailing profile was observed. MS analysis indicated that the first set of peaks could be accurately assigned as the G0F/G0F, G0F/G1F, G1F/G1F, and G1F/G2F glycoforms of intact trastuzumab. An intact IgG is a dimeric structure, with a minimum of two N-glycan sites on two heavy chains, explaining the observation of combinatorially formed glycoforms. This is consistent with observations by intact mass analysis of IgGs.10 The tailing component of the chromatographic profile was in contrast found by MS to correspond to multiple, co-eluting trastuzumab glycoforms. With this result, we proposed that on-column aggregation was occurring and that increased column pressure could be a solution to HILIC of intact immunoglobulins, specifically since it had previously been reported that ultrahigh pressures can be beneficial to limiting carryover and ghosting during reversed phase of intact proteins.11 The effects of introducing additional column pressure was investigated by means of introducing varying lengths of narrow I.D., post-column PEEK tubing. Figure 7 (darker traces) displays the effects of introducing increasingly higher column pressure. By doubling the column pressure so that trastuzumab would elute under conditions of approximately 7,500 psi, the putative, aggregate peaks in the chromatographic profile were eliminated. It is encouraging that under these conditions the resulting chromatographic profile is represented by 5 major glycoforms, which again is consistent with ESI-MS of intact trastuzumab.10 It is interesting to additionally note that retention decreases as column pressure increases. This is a phenomenon that has been described previously for HILIC separations of monosaccharides.12 It has been proposed that increasingly higher pressures result in less coordination of water to the analyte and in turn reduced retention, an opposite effect to that observed during reversed phase chromatography.12

Figure 7. Effect of column pressure on the HILIC separation of an IgG. Trastuzumab (1 µg) was separated on Glycoprotein BEH Amide, 300Å, 1.7 µm, 2.1 x 150 mm Column with and without flow restriction. [PDB:1IGT]

Given that intact IgGs benefit from separations at ultrahigh pressures, we pursued separations based on the use of two BEH amide 300Å, 1.7 µm, 2.1 x 150 mm columns coupled with a low volume, high pressure column connector. The separation for intact trastuzumab obtained with these coupled columns is displayed in Figure 8, along with extracted ion chromatograms that provide evidence to achieving separations of the glycoforms. This  300 mm configuration provided the requisite column pressures for an optimal HILIC separation and additionally produced greater resolution between glycoforms. Clearly, additional theoretical plates are therefore advantageous during HILIC of even very high molecular weight species, which supports the significance of partitioning for such separations. 

An LC method for glycan occupancy

A UPLC HILIC separation of an intact IgG can be used for more than just an attempt to separate individual glycoforms. Equally interesting is the use of these new separation capabilities to resolve information about glycan occupancy. To this end, we evaluated the capabilities of the BEH Amide, 300Å column to assess the glycan occupancy of an IgG. This was exemplified by a study of reaction products resulting from various PNGase F deglycosylation treatments. Using an elevated 80 °C column temperature, TFA ion pairing, and an HFIP mobile phase additive, we have been successful in enhancing the solubility of IgGs and collapsing the fine structure otherwise captured for the individual, heterogenous intact  IgG glycoforms (i.e. G0F/G0F versus G0F/G1F). Figure 9 presents HILIC fluorescence chromatograms resulting from such a separation of native Intact mAb Mass Check Standard (a murine IgG1 mAb) and its partially as well as completely deglycosylated isoforms. As can be seen, HILIC fluorescence  profiles for these three samples are dramatically different. On-line mass spectrometric detection  has confirmed that the peaks in these profiles correspond to different states of glycan occupancy.  

Figure 8. Separation of intact trastuzumab glycoforms using coupled ACQUITY UPLC Glycoprotein BEH Amide, 300Å, 1.7 µm, 2.1 x 150 mm Columns. A UV chromatogram and extracted ion chromatograms for each of the major heterogenous glycoforms of trastuzumab are displayed.  The column pressure at the retention time of the mAb was approximately 7,000 psi.
Figure 9. Assaying glycan occupancy and deglycosylation by intact protein HILIC-FLR-MS. HILIC fluorescence profiles obtained for three different samples are shown: (A) native, (B) partially deglycosylated, and (C) completely deglycosylated Intact mAb Mass Check Standard. Samples  of this mAb (1.5 µg) were separated using two coupled Glycoprotein BEH Amide, 300Å, 1.7 µm, 2.1 x 150 mm Columns. HILIC fluorescence profiles of partially deglycosylated Intact mAb Mass Check Standard using a (D) ACQUITY UPLC Glycan BEH Amide, 130Å, 1.7 µm, 2.1 x 150 mm Column versus a (E) Glycoprotein BEH Amide, 300Å, 1.7 µm, 2.1 x 150 mm Column.

The most strongly retained species, represented by the native mAb sample, corresponds to the doubly (fully) glycosylated form of the intact mAb. The partially deglycosylated mAb sample meanwhile yielded several additional peaks with lower HILIC retention, two of which with corresponding detected molecular weights that are indicative of once deglycosylated and fully deglycosylated mAb species and a third with a corresponding detected molecular weight consistent with PNGase F. In contrast, the completely deglycosylated mAb sample presented a homogenous fluorescence profile along with an observed molecular weight for the mAb that is in agreement with the predicted molecular weight of the deglycosylated mAb (145.3 kDa). It is worth noting that when attempting to use the BEH Amide, 130Å, 1.7 µm stationary phase, none of the above peaks could be resolved (Figures 9D and 9E). So indeed, the widepore phase facilitates the development of previously unobtainable separations.

In our hands, the above assay has been used to develop rapid enzymatic deglycosylation protocols.3 However, it is natural to suggest that these same methods could be applied to measure the glycan occupancy of an intact therapeutic mAb, in which case the relative abundance of aglycosylated forms (-2 and -1 N-glycans) could potentially be monitored by fluorescence and corroborated by LC-MS.

Conclusion

HILIC of small molecules has garnered wide-spread attention and use. In contrast, the application of the technique to large biomolecule separations has been limited. With the development of the above mentioned amide-bonded, wide-pore HILIC stationary phase and corresponding methods, it is now possible to resolve the glycoforms of intact glycosylated proteins, as has been exemplified by the resolution of the heterogenous glycoforms on intact trastuzumab. Alternatively, the described techniques can be applied to studies of glycan occupancy. Just as reversed phase separations are employed for resolving protein isoforms that have varying hydrophobicities, HILIC separations with BEH Amide 300Å can be explored for resolving protein isoforms that exhibit varying hydrophilicities, such as isoforms differing with respect to glycan occupancy. With the availability of these new separation capabilities, it will be possible to perform more detailed characterization of intact glycoproteins, whether by means of combining HILIC with optical detection or with ESI-MS. 

References

  1. Ahn, J.; Yu, Y. Q.; Gilar, M., UPLC-FLR Method Development of 2-AB Labeled Glycan Separation in Hydrophilic Interaction Chromatography (HILIC). Waters Appication Note 720003238EN 2010.
  2. Ahn, J.; Bones, J.; Yu, Y. Q.; Rudd, P. M.; Gilar, M., Separation of 2-aminobenzamide labeled glycans using hydrophilic interaction chromatography columns packed with 1.7 microm sorbent. J Chromatogr B Analyt Technol Biomed Life Sci 2010, 878 (3–4), 403–8.
  3. Lauber, M. A.; Brousmiche, D. W.; Hua, Z.; Koza, S. M.; Guthrie, E.; Magnelli, P.; Taron, C. H.; Fountain, K. J., Rapid Preparation of Released N-Glycans for HILIC Analysis Using a Novel Fluorescence and MS-Active Labeling Reagent. Waters Application Note 720005275EN 2015.
  4. Wang, B.; Tsybovsky, Y.; Palczewski, K.; Chance, M. R., Reliable Determination of Site-Specific In Vivo Protein N-Glycosylation Based on Collision-Induced MS/MS and Chromatographic Retention Time. J Am Soc Mass Spectrom 2014, 25 (5), 729–41.
  5. Shah, B.; Jiang, X. G.; Chen, L.; Zhang, Z., LC-MS/MS peptide mapping with automated data processing for routine profiling of N-glycans in immunoglobulins. J Am Soc Mass Spectrom 2014, 25 (6), 999–1011.
  6. Houel, S.; Hilliard, M.; Yu, Y. Q.; McLoughlin, N.; Martin, S. M.; Rudd, P. M.; Williams, J. P.; Chen, W., N- and O-glycosylation analysis of etanercept using liquid chromatography and quadrupole time-of-flight mass spectrometry equipped with electron-transfer dissociation functionality. Anal Chem 2014, 86 (1), 576–84.
  7. Gilar, M.; Yu, Y. Q.; Ahn, J.; Xie, H.; Han, H.; Ying, W.; Qian, X., Characterization of glycoprotein digests with hydrophilic interaction chromatography and mass spectrometry. Anal Biochem 2011, 417 (1), 80–8.
  8. O’Gara, J. E.; Wyndham, K. D., Porous Hybrid Organic-Inorganic Particles in Reversed-Phase Liquid Chromatography. J Liq Chromatogr Relat Technol. 2006, 29, 1025–1045.
  9. Alpert, A. J., Hydrophilic-interaction chromatography for the separation of peptides, nucleic acids and other polar compounds. J Chromatogr 1990, 499, 177–96.
  10. Xie, H.; Chakraborty, A.; Ahn, J.; Yu, Y. Q.; Dakshinamoorthy, D. P.; Gilar, M.; Chen, W.; Skilton, S. J.; Mazzeo, J. R., Rapid comparison of a candidate biosimilar to an innovator monoclonal antibody with advanced liquid chromatography and mass spectrometry technologies. MAbs 2010, 2 (4).
  11. Eschelbach, J. W.; Jorgenson, J. W., Improved protein recovery in reversed-phase liquid chromatography by the use of ultrahigh pressures. Anal Chem 2006, 78 (5), 1697–706.
  12. Neue, U. D.; Hudalla, C. J.; Iraneta, P. C., Influence of pressure on the retention of sugars in hydrophilic interaction chromatography. J Sep Sci 2010, 33 (6–7), 838-40.

720005380, April 2015

Back To Top Back To Top