Peptide-based therapeutics have recently seen a renewed interest due in part to overcoming some of the early challenges imparted by their physicochemical properties.1,2 Therapeutic peptides can be produced through chemical synthesis, recombinant strategies, or through extraction from a natural source.1 Although each route can offer advantages, an increasing number of these drugs are now being made synthetically.
When following a synthetic approach, the raw materials as well as the manufacturing process can both contribute to process-related impurities, where many of the modifications or deletions can be pre-determined,3 and are generally considered to be safe at low levels.4
Most often, determining synthetic peptide purity is an LC-UV-based assay.5,6 Recent work by Zeng and colleagues reported that their LC-HRMS method could identify additional impurities not reported through the USP HPLC-UV method for a currently marketed product.7 The notion that manufacturers should continually strive to improve product knowledge with the interest of public health in mind has global implications. The International Council for Harmonisation (ICH), which brings together regulators and the pharmaceutical industry from Europe, Japan, and the United States, addresses this need with ICH Q10, a quality document that supports innovation and continual improvement throughout product lifecycle.8 In the current study, we show that by incorporating the ACQUITY QDa Detector, a cost effective mass detector, impurities can be identified without the need for expensive instrumentation. Because impurities that are not qualified generally have tighter acceptance criteria,6 added mass detection can more readily confirm impurity identification than relying on relative retention time from an optical-based assay.
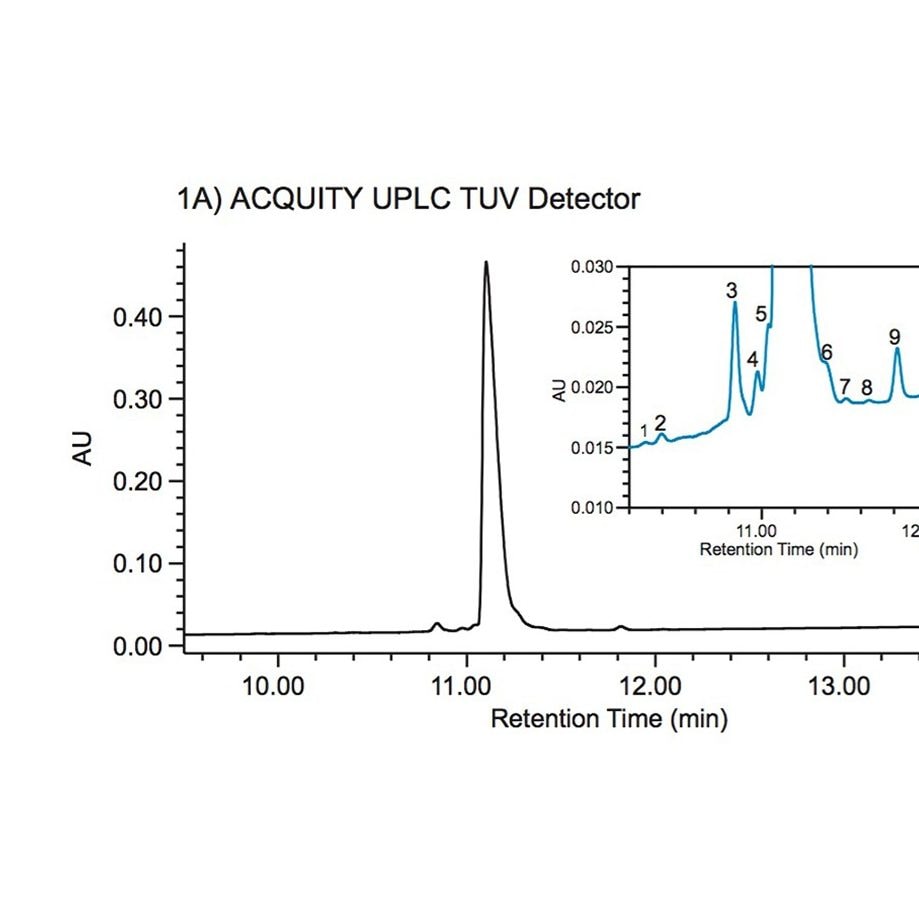
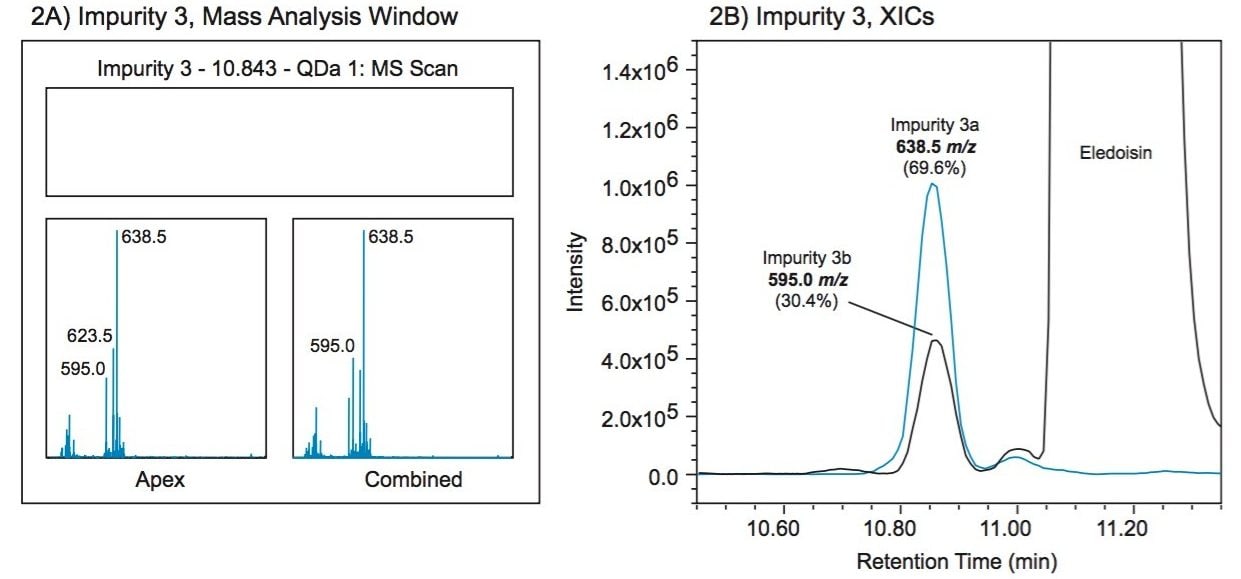
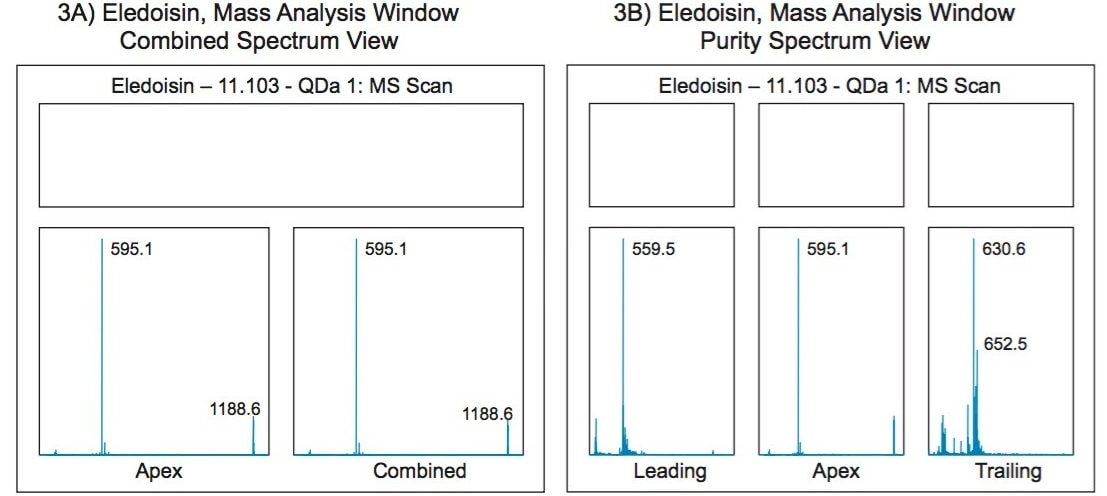
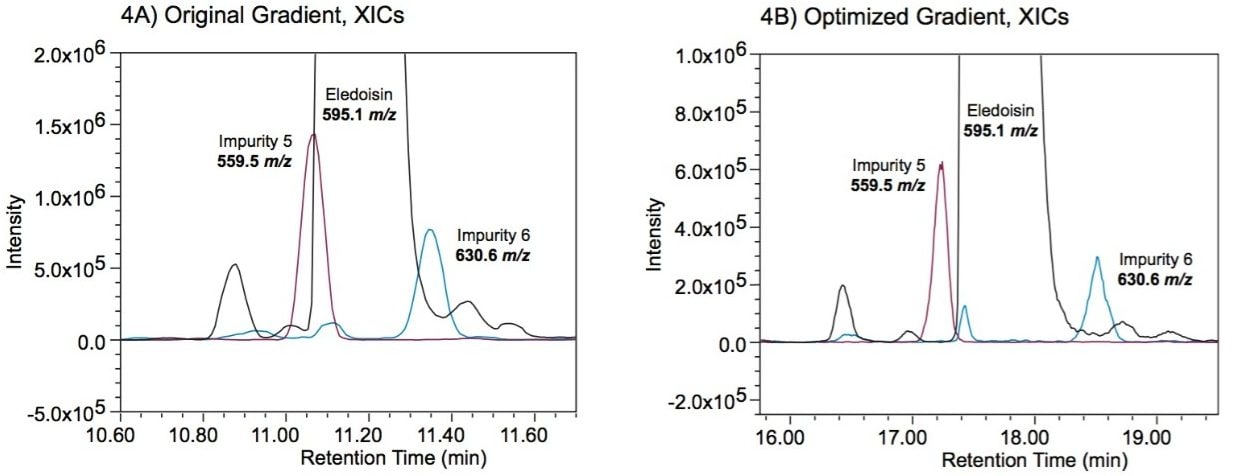
In this study, eledoisin, a vasodilator, is used as a clinically relevant sample to demonstrate how the ACQUITY QDa Detector with Empower 3 Software can be used for synthetic peptide impurity monitoring. Eledoisin impurities can be documented via traditional optical-based methods, but by incorporating the ACQUITY QDa Detector, co-elutions can be realized. This strategy demonstrates the ability to improve confidence in a manufacturing environment by combining optical detection and orthogonal mass detection into a single workflow.