This application note demonstrates the analysis of alcoholic beverages to determine brand authenticity using Waters DART QDa with LiveID system.
Whisky (whiskey), a popular spirit drink, is sold worldwide, either as the product of one distillery or as a blend of two of more distilleries. Analytical methods are required for process control and quality assurance processes. The popularity of premium whisky products such as Scotch Whisky generates a high risk of fraud, and methods are also required by those agencies involved in inspection and enforcement to confirm the authenticity of whisky brands. Scotch Whisky production has been defined in UK law for many years and is currently set out in the Scotch Whisky Regulations 2009.1 The definition requires Scotch Whisky to be wholly produced in Scotland from three raw materials: cereals, yeast, and water. It defines the process by which Scotch Whisky is made and not the analytical properties of the finished product. The European Union established rules on the definition, description, and presentation of spirit drinks under Council Regulation (EEC) 1576/89 [repealed and replaced by EC No. 110/200838] in which Scotch Whisky was recognized as a geographical designation.2,3 Regulations in many other countries defining Scotch Whisky often make direct reference to the UK process definition including The USA Code of Federal Regulations4 and The Canadian Food and Drug Regulations.5
The resulting product characteristics of Scotch Whisky are known to be strongly influenced by the raw materials and fermentation, distillation, maturation, and blending regimes. This leads to characteristic analytical profiles for various volatile congeners, principally derived from the fermentation process, as well as maturation components extracted from the cask; these compounds have been used as reference points in authenticity analysis. Routine analysis of Scotch Whisky involves separation techniques, such as gas or liquid chromatography, often coupled with commonly available detectors, including UV, flame ionization detector (FID), or mass spectrometry (MS). These targeted techniques have been used to characterize many of the major compounds in whisky, as well as for authenticity analysis. Whisky fraud can be a highly sophisticated business and targeted/semi-targeted methods can miss some of the unique features in a particular whisky. Therefore, the whole “fingerprint” is often required to detect subtle changes in the chemical profile of the whisky and reliably detect adulteration or pick up changes in product consistency or quality.
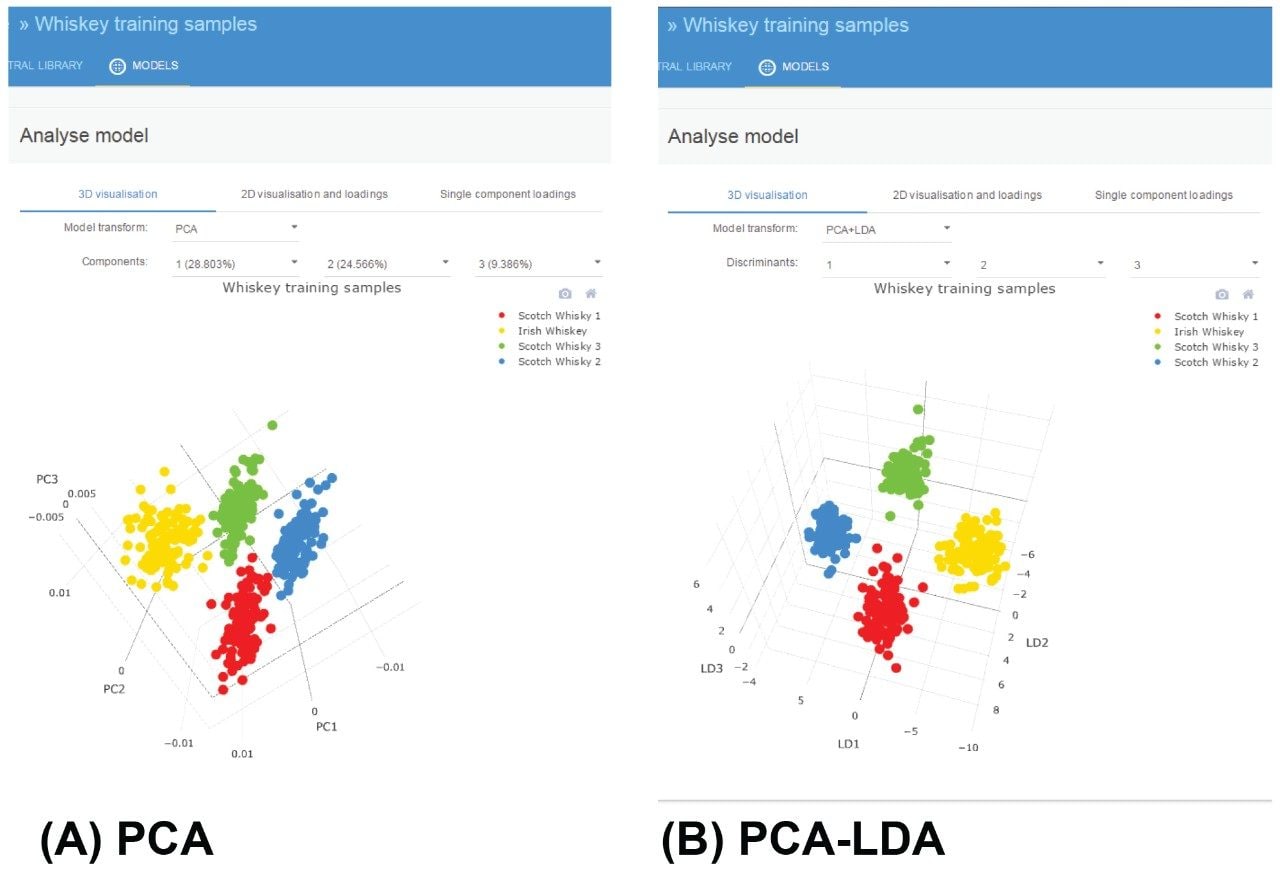
A powerful approach for chemical profiling is the use of MS-based techniques coupled to multivariate analysis (MVA). For example, pyrolysis–GC-MS followed by Principal Component Analysis (PCA) of the resulting mass spectra has revealed the chemistry responsible for the different flavor profiles of Scotch whisky produced using peat sourced from four geographical locations.6 Direct Analysis MS, using extremely high mass resolving power of Fourier transform ion cyclotron resonance mass spectrometry (FT-ICR MS) has been used to detect the key compounds responsible for discriminating between types of whisky (blend or malt) or maturation wood type.7 Many other analytical strategies including UV, RAMAN, NIRS, FTIR, and even NMR have also been reported in the literature for verification of brand authenticity.8,9 Such research platforms are often not considered “fit for purpose” by the industry. There is a need for the development of analytical tools which combine the specificity of a detailed chemical profile of the sample along with the robustness and applicability needed for routine use.
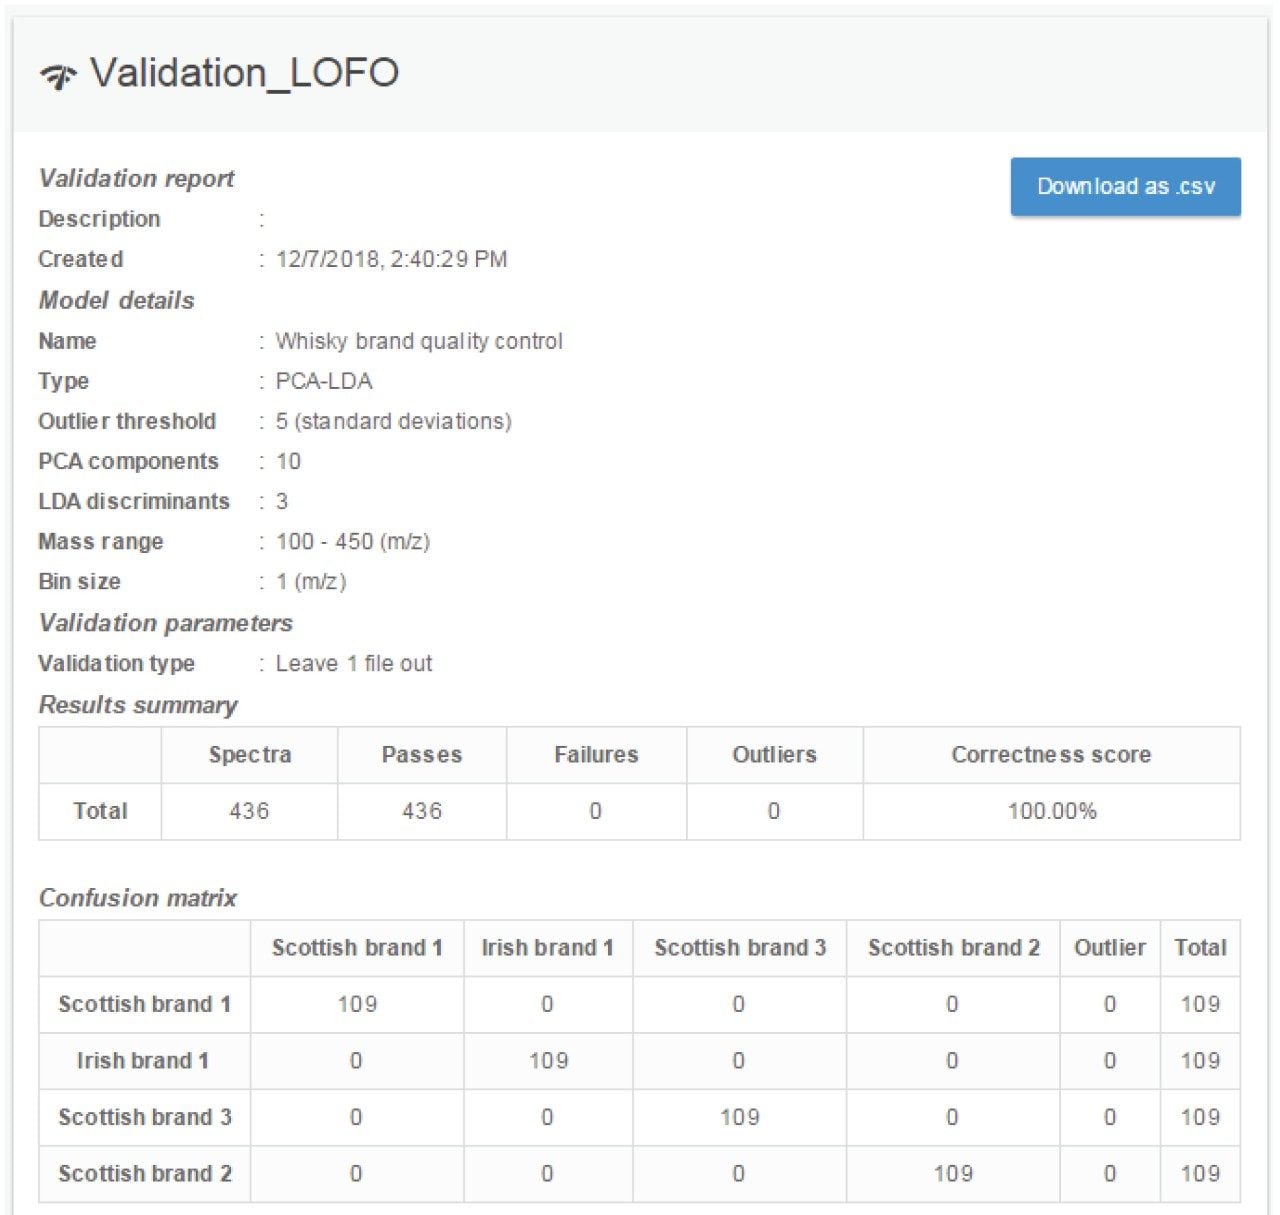
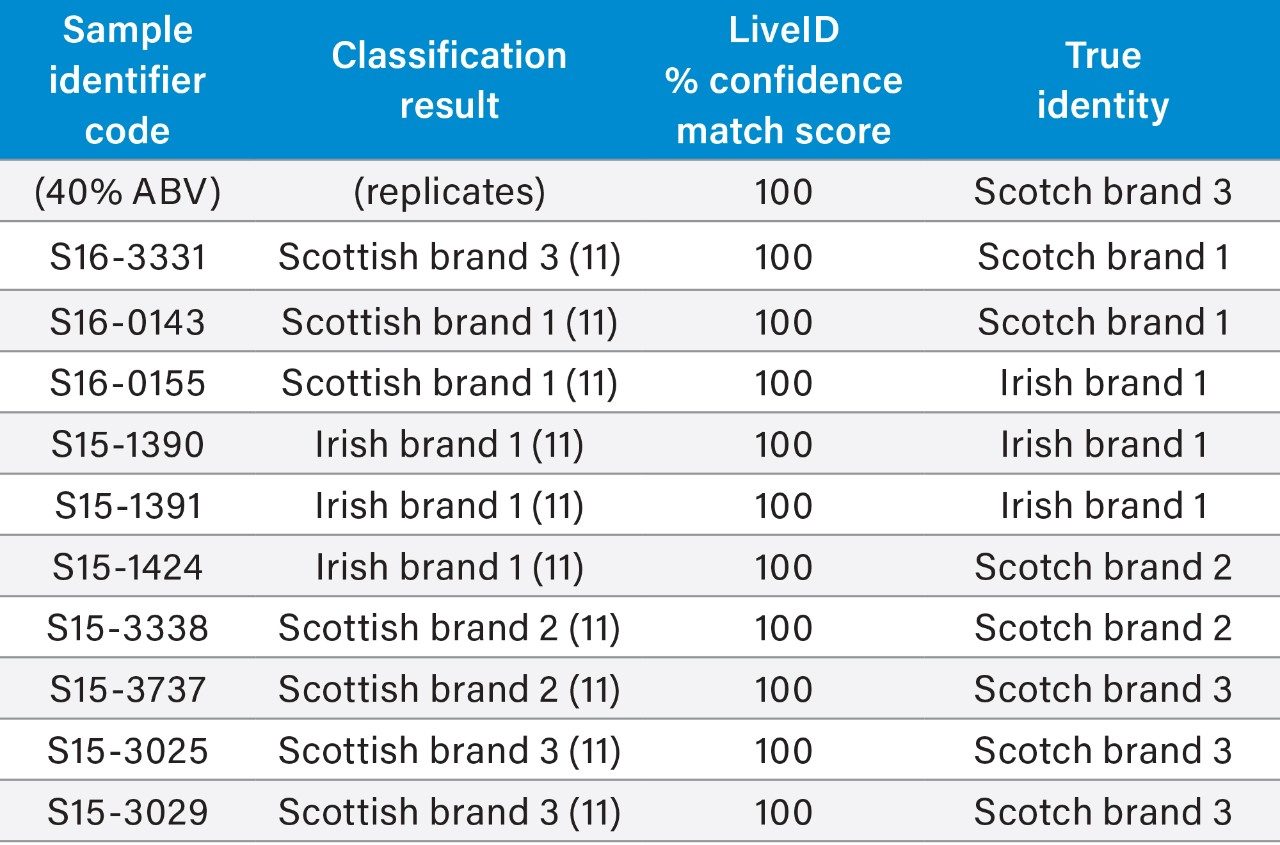
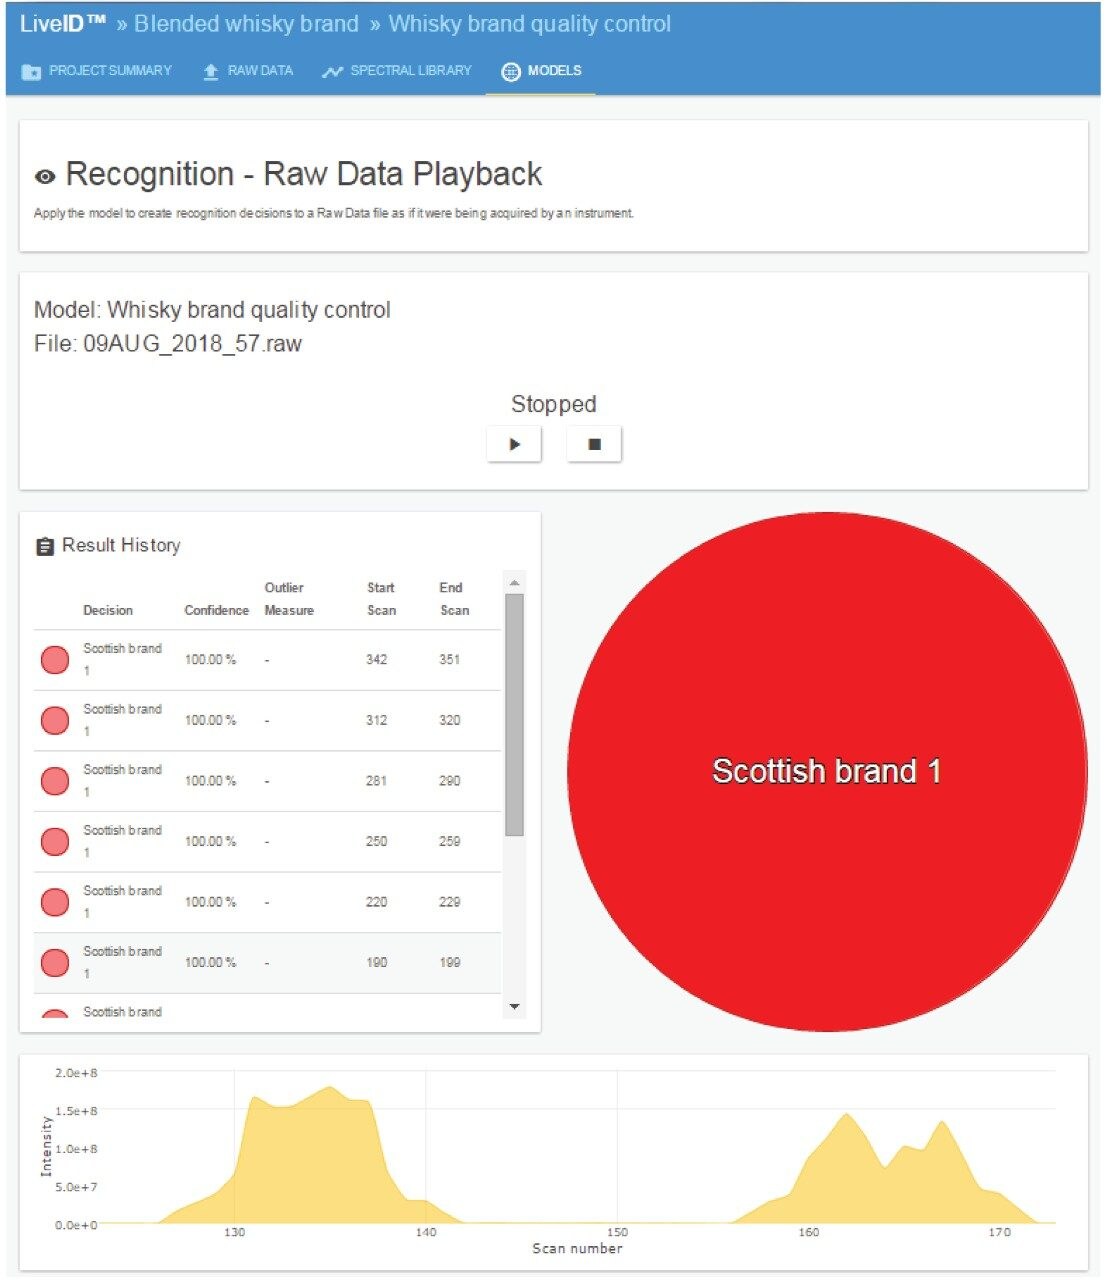
We have previously demonstrated the potential of Direct Analysis in Real Time (DART) coupled with simple mass detection (ACQUITY QDa) and multivariate statistics for the rapid analysis of whisky and bourbon brands. In this application note, we report further results of the comparative study using Waters DART QDa with LiveID System for the analysis of blended whisky brands to determine brand authenticity.
Representative samples of four different brands of blended Scotch and Irish whiskys were supplied by the Scotch Whisky Research Institute (SWRI) for training the chemometric model. Samples collected from 10 different production batches of each blended whisky brand were provided. A validation set of 10 single blind coded samples were provided for subsequent validation of the predictive accuracy of the model.
10 µL of the neat whisky samples were spotted directly onto the DART QuickStrip cards and allowed to dry under ambient conditions. The samples were then analyzed by DART according to the following MS conditions. For model training purposes, technical replicates (n=10) of each sample were used.
MS system: |
ACQUITY QDa |
MS source: |
DART SVP |
Ionization mode: |
DART+ |
Acquisition mode: |
Full scan MS |
Gas: |
He |
Gas temp.: |
350 °C |
Sampling speed: |
1.00 mm/sec |
Sampling frequency: |
2 Hz |
Cone voltage: |
15 V |
Mass range: |
100 to 450 m/z (continuum) |
MassLynx (v4.2) and LiveID (v1.2) multivariate statistical software package was used as a chemometric model building and real-time sample recognition tool.
The workflow illustrated in Figure 1 was followed for the chemometric model training.
Combined spectrometric data obtained from four different brands of blended Scotch (n=3) and Irish (n=1) whiskys with an ABV of 40% were used to train the chemometric model. For each brand, 10 different production batches were included. For each sample, replicate measurements of n=11 were made.
All chemometric models were calculated using the region of 100 to 450 m/z, as no significant features were observed above 450 m/z. For model training purposes, 10 PCA components and 3 LDA components were used. Class related clustering was apparent within the three-dimensional (3D) PCA scores plot using components 1, 2, and 3 (Figure 2A). The combination of PCA (for data dimension reduction) and the supervised LDA generated four discrete class-based groupings within a 5 standard deviation outlier threshold (Figure 2B).
The 2D loadings plot in Figure 3 shows the significant ions contributing to the brand level discrimination. Ions at 127.0 m/z (tentative identity of the protonated species of 5-hydroxymethyl furfural), 306.5 (unknown), 342.5 (unknown), and 420.5 (unknown) are seen to be the major contributory features driving unsupervised separation in PC 1. Greater than 80% of the overall variance is explained within the first five principal components.
These discriminatory ion features are believed to be formed from compounds in the whisky samples such as sugars, lactones, and phenolic species, the addition of caramel, and Maillard reaction products.
An in silico validation of the model was performed using the “leave one file out” validation tool iteratively to optimize the chemometric modelling parameters chosen. Following the optimization step, an overall correctness score (predictive accuracy) calculated from a model containing 436 spectra of 100% was achieved using the training set data, as shown in Figure 4.
Following the model training, optimization and in silico validation phase, an independent validation was performed. A set of 10 single blind coded samples of the same four whisky brands were analyzed (replicates of n=11) on a second day and the classification results and confidence match scores were recorded (Table 1). The classification results were compared to the SWRI declared identities, and the correct classification was achieved for all 10 of the single blind coded samples.
As a further investigation of the robustness and predictive accuracy of the model, a single blind coded sample of one of the blended brands containing a higher alcohol content of 43% (export strength blend) was analyzed. The model correctly classified this sample as Scotch Whisky brand 1 with 100% match confidence (Figure 5). This finding indicates that the brand model classification is based on discriminatory m/z features independent of the ethanol fraction.
720006530, April 2019