This is an Application Brief and does not contain a detailed Experimental section.
This application brief demonstrates the CCS values of hundreds of pesticide compounds which were predicted using CCSondemand.
Ion mobility-mass spectrometry (IM-MS) is an innovative 2D detection technique that integrates ion mobility separation (IMS) and mass spectrometry (MS). This technology has been maturing over decades of development and is quickly becoming one of the forefront fields of modern analytical chemistry. Collision cross section (CCS) is an important parameter for discriminating compounds in IM-MS. CCS values remain constant, regardless of instrumentation and experimental conditions, exhibiting unique advantage in qualitative analysis. However, in the absence of CCS reference values for unknowns, the question arises whether a prediction of the CCS value for an unknown can add value to an analysis.
Several CCS prediction tools have emerged in the public domain. Most of them are machine learning based, which train a model using a large number of experimental CCS values, combined with the structural properties of the compounds. By establishing the relationships between the structure and CCS values of compounds, the CCS values can be predicted for a specified structure.
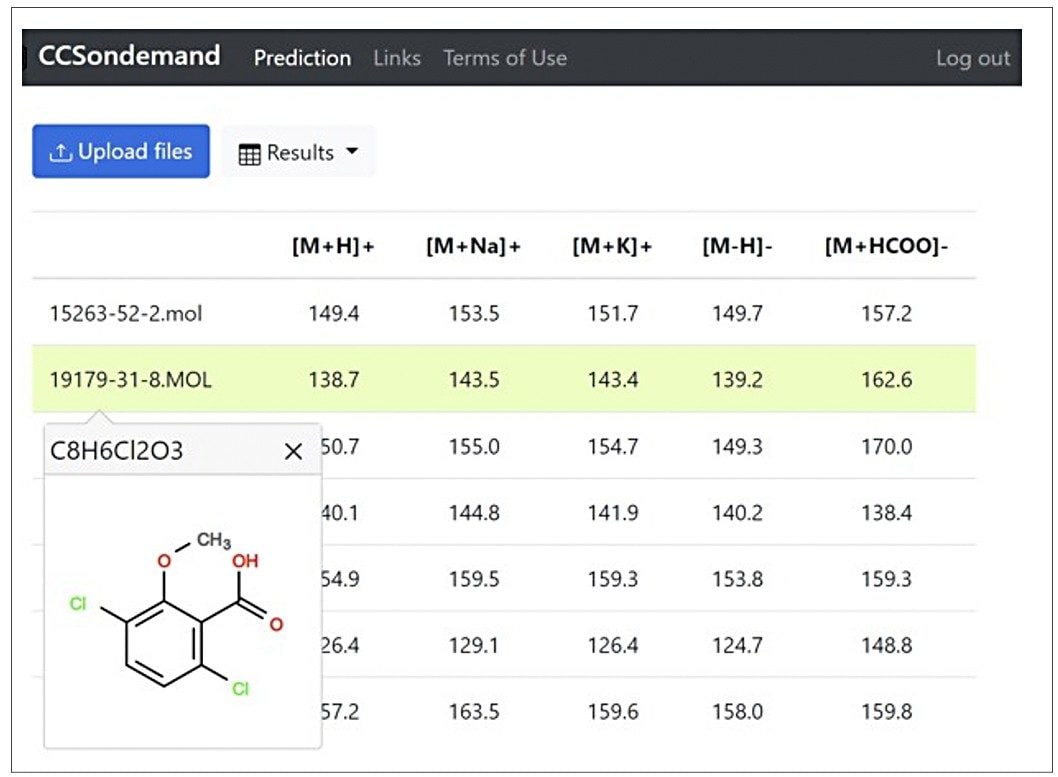
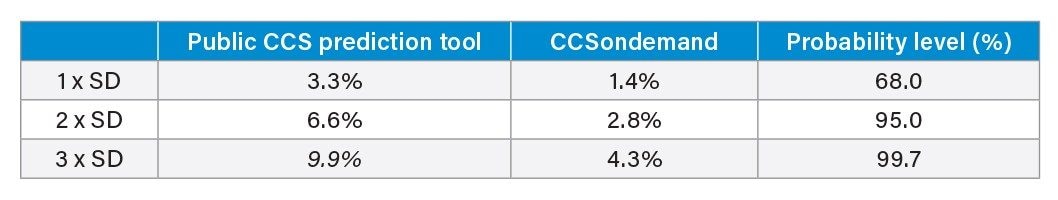
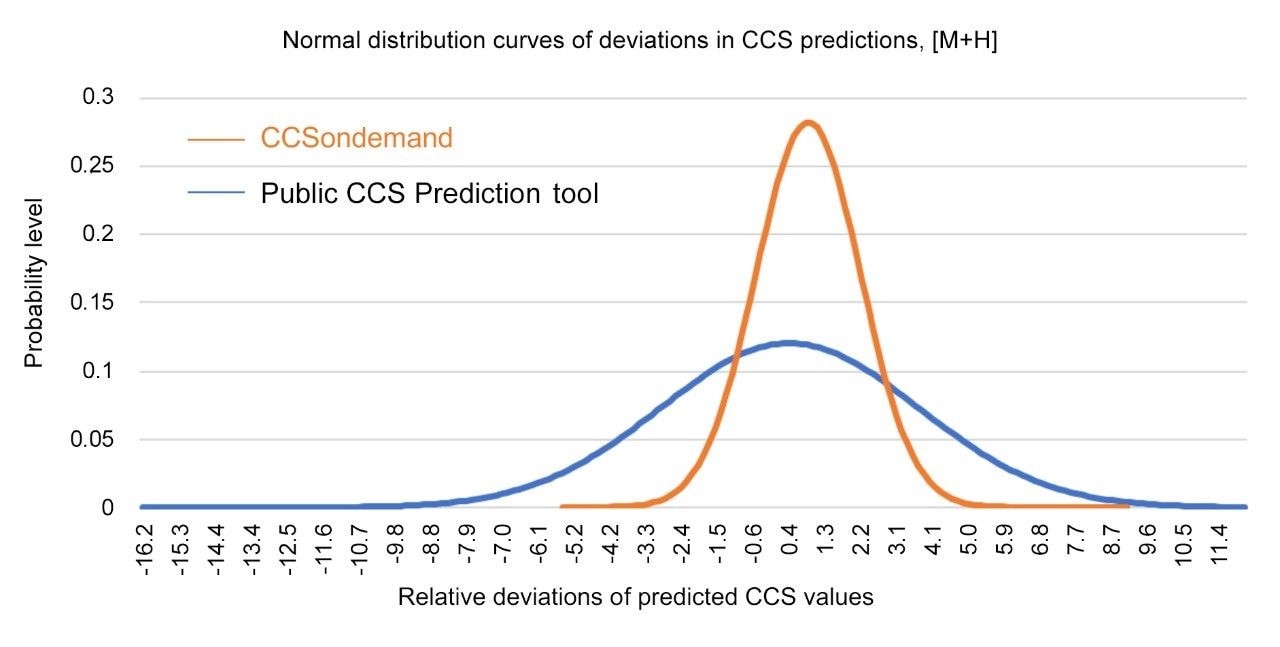
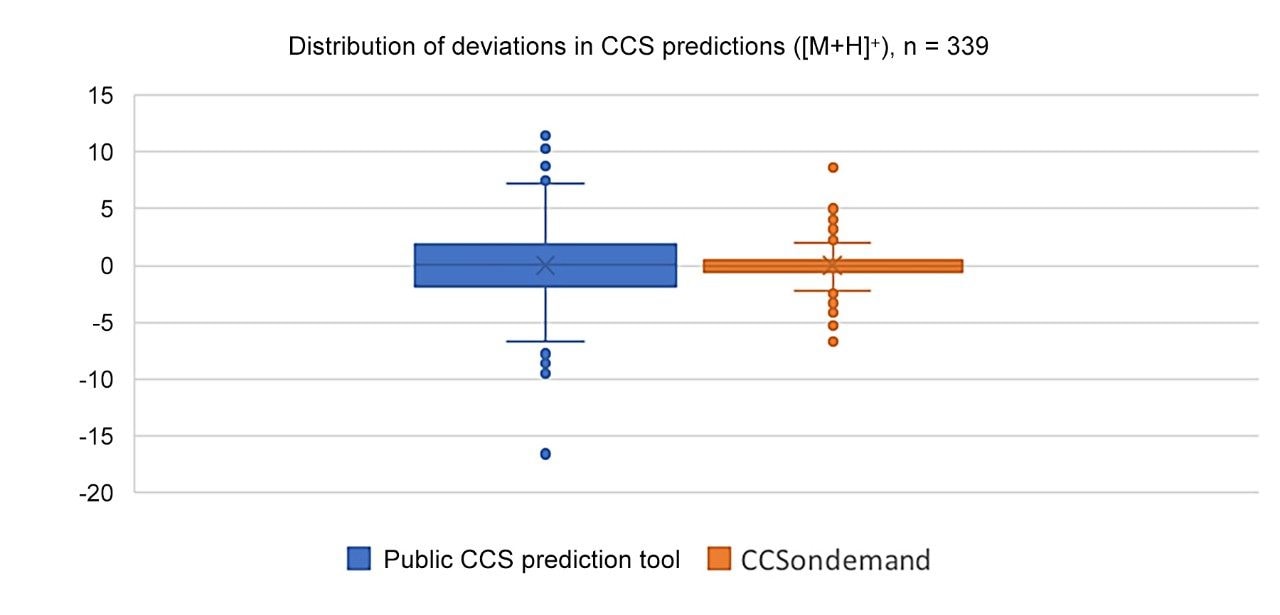
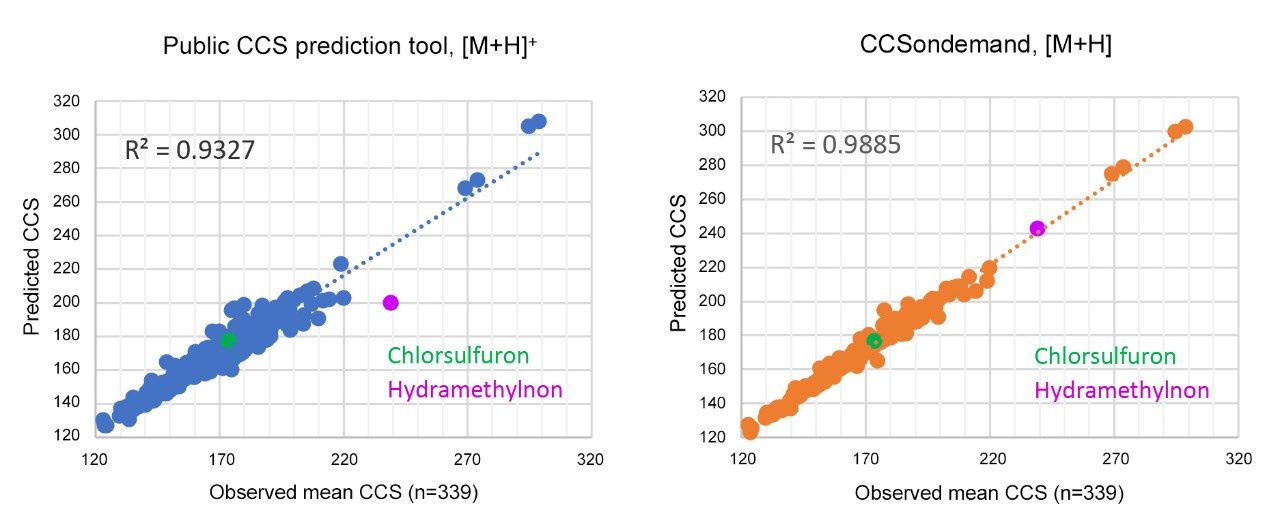
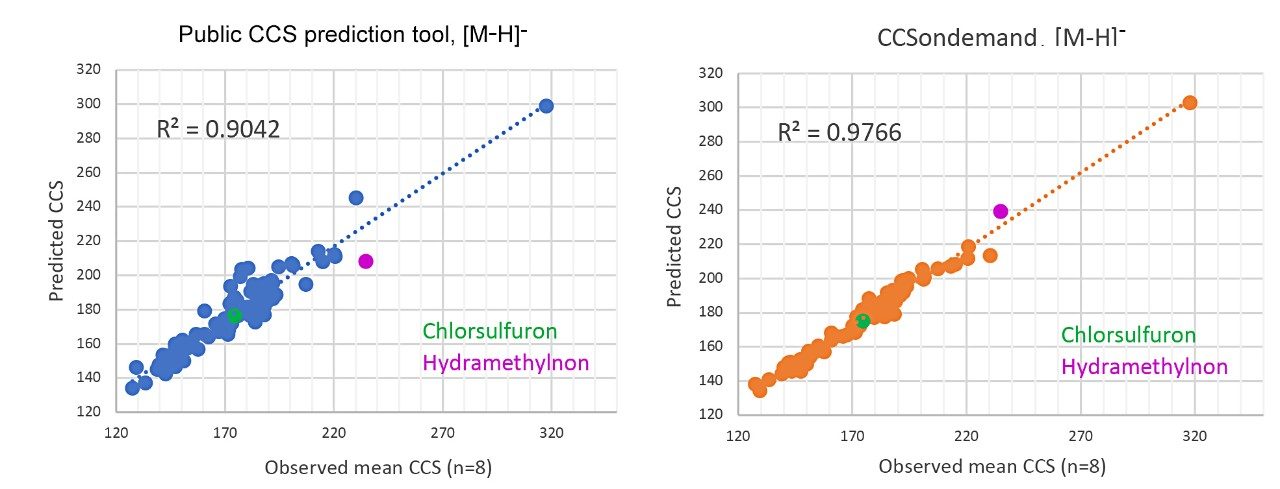
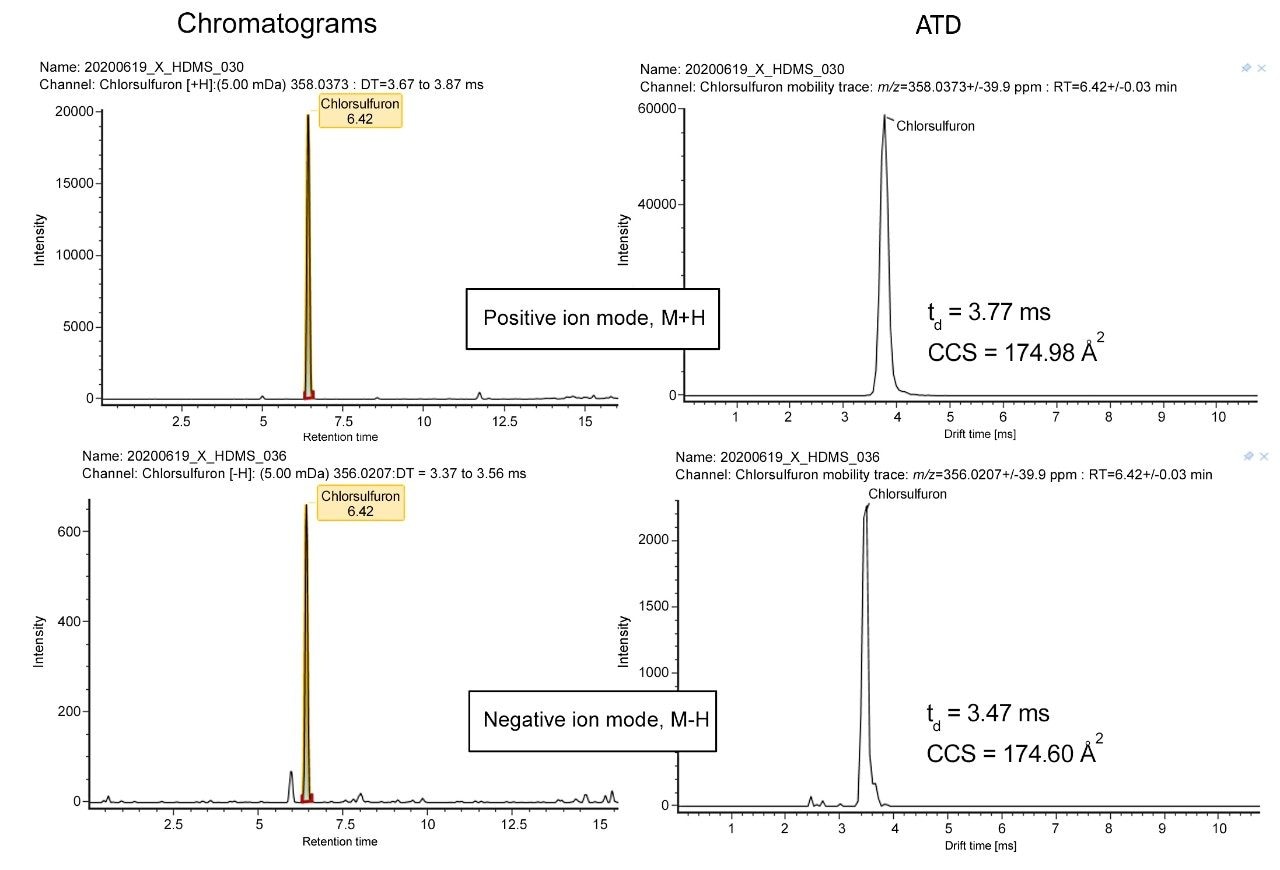
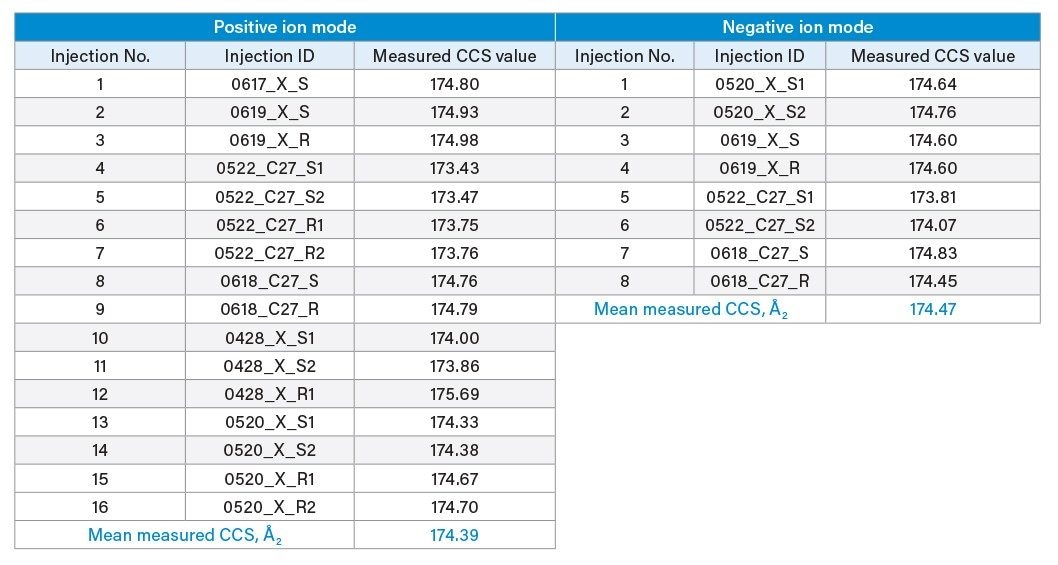
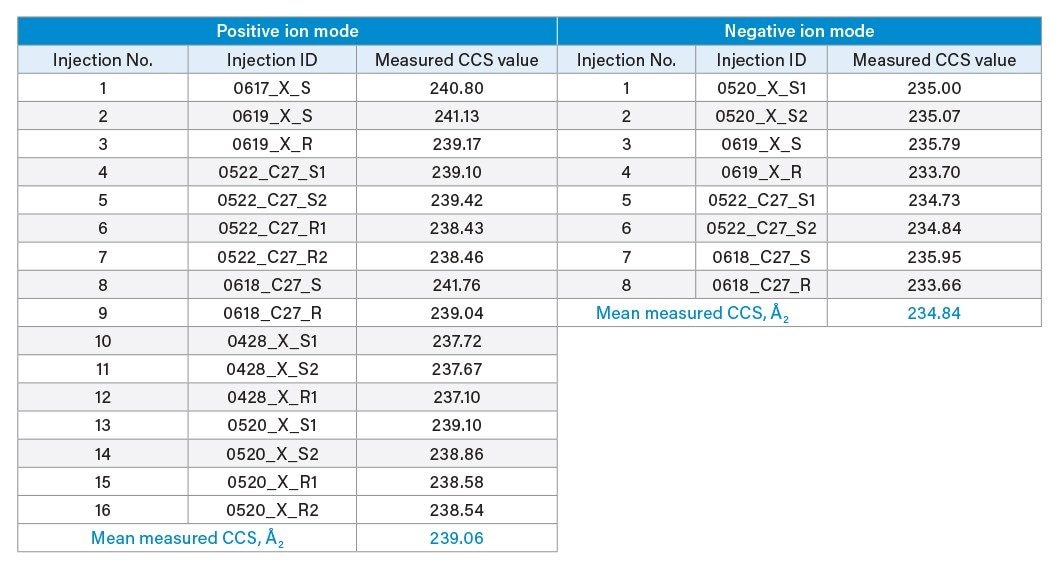
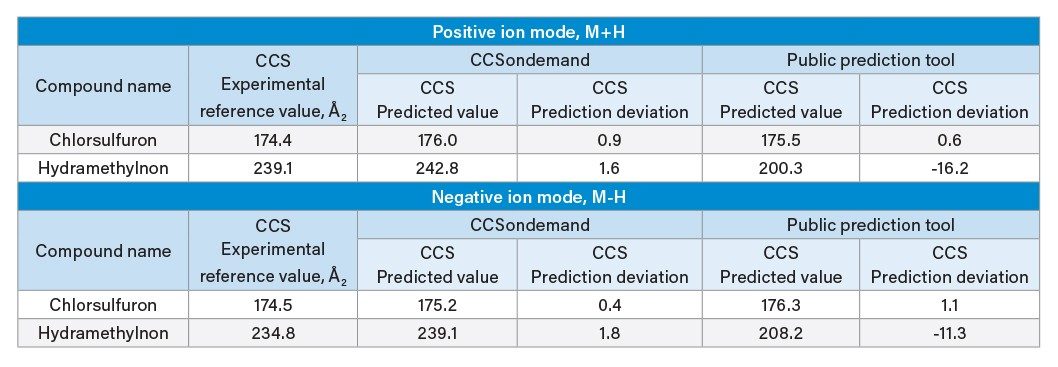
In this application brief, the CCS values of hundreds of pesticide compounds were predicted using CCSondemand. To evaluate the accuracy of CCSondemand, the predicted values were compared with the mean CCS values observed from multiple experimental analyses; in addition, a public CCS prediction tool was used to predict the CCS values of the same compound data set. Finally, evaluation of the two prediction tools was undertaken in terms of prediction accuracy and overall performance. The models provided useful outcomes comparable with those obtained from the publicly available model.
As one of the key pioneers in IM-MS, Waters has demonstrated that it continues to be a technical leader in this cutting-edge analysis realm with its strong, enduring, and comprehensive innovation capabilities in science and technology.
A standard mixture containing 20 pesticides (P/N: 186006348), diluted to a desired concentration with 50% acetonitrile, was used as a quality control sample to monitor and adjust retention time prior to data acquisition of a real sample. The real sample was a mixed solution containing hundreds of pesticides, hereafter referred to as the “pooled standard sample”. The screening workflow in UNIFI Scientific Information System was used to analyze the acquired data. The screening workflow was based on a self-built high resolution tandem MS spectra library consisting of over 500 pesticide compounds for positive ion mode and over 100 pesticide compounds for negative ion mode. The compound attributes used in the qualitative screen included exact mass, retention time, and structural formulas of precursor/fragment ions, as well as the theoretical fragment ions (generated automatically by UNIFI based on the compound structure).
For the compounds consistently detected in all runs, the mean value and relative standard deviation (RSD) of CCS obtained in multiple injections were calculated. The mean CCS values of compounds having an RSD less than 1% were subsequently used as reference criteria for evaluating the accuracy of the CCS prediction tools.
Separation system: |
ACQUITY UPLC I-Class |
Columns: |
XSelect HSS T3, 2.5 µm, 2.1 × 100 mm, (P/N: 186006151) CORTECS T3, 2.7 µm, 2.1 × 100 mm, (P/N: 186008484) |
Temperature: |
45 °C |
Mobile phase: |
Aqueous phase (A) 5 mM NH4FA in Water + 0.1% FA organic phase (B) 50% methanol + 50% acetonitrile |
MS systems: |
SYNAPT G2-Si HDMS SYNAPT XS HDMS |
System resolution: |
Sensitivity mode Resolution mode |
System calibration: |
Mass axis calibration: Sodium formate solution CCS calibration: Major mix (P/N: 186008113) Real-time calibration (CCSLockmass): Leucine enkephalin solution |
Data acquisition: |
HDMSE Mass range: 50–1000 Da HDMSE Collision energy: Low energy off; High energy 10–40 eV |
A number of research teams have focused their R&D efforts on CCS prediction and as a result multiple prediction tools are available online. The required input for compounds requiring CCS prediction varies in each of the tools. Some tools require many types of information to afford predictions for each compound; others are less readily accessible online and require some computing knowledge, or are not openly available. For this study, a public CCS prediction tool (anonymous, hereafter referred to as the “public CCS prediction tool”) was used. This prediction tool was developed based on a machine learning approach and trained on a large number of experimental CCS values obtained by drift tube ion mobility and traveling wave ion mobility techniques. It predicts the CCS values of multiple ion adducts, such as [M+H]+, [M+Na]+, [M+NH4]+, and [M-H]-, from the structure of the compound.
Waters Corporation has developed a research prototype application for CCS prediction, called CCSondemand, which also uses a machine learning based approach and it’s model trained using with experimental CCS values from different ion adducts generated from a great number of compounds obtained on multiple instruments (Vion and SYNAPT). To use this tool, you need only to provide the chemical structure of a compound of interest. The tool is compatible with multiple chemical structure formats, such as mol, sdf, inchi, and SMILE, and is able to predict the CCS values of five ion adducts, namely, [M+H]+, [M+Na]+, [M+K]+, [M-H]-, and [M+HCOO]-. The user interface of CCSondemand is shown in Figure 1.
Data acquisition of the pooled standard sample (containing hundreds of small molecule pesticide compounds) was performed multiple times. As can be seen from the injection information shown in Table 1 (positive ion mode) and Table 2 (negative ion mode), despite the number of injections varying somewhat due to study objective limitations, a large number of experimental variables, i.e. MS instrument, MS resolution, chromatographic column, and data of acquisition were purposely varied to demonstrate that CCS is a robust and reproducible analytical parameter.
More than 500 compounds from the self-built library were used to screen the data obtained in positive ion mode. 339 compounds were detected in 16 screening injections. For negative ion mode, 92 compounds were detected in 8 screening injections, using over 100 compounds from the library. According to the analysis results, the measured CCS values for some injections of 31 compounds were not correctly assigned due to signal overloading. These CCS values were therefore not considered for analysis, with the number of rejected values varied between 1 and 6. The RSD of the remaining measured CCS values for each compound was typically less than 1% with the distribution of the RSD values shown in Figure 2.
Standard deviations (SDs) are known to be very sensitive to extremely large or small intra-group errors and can be used as a measure for the uncertainty and degree of dispersion of observed values within a group, in light of the diversity of the experimental design. If the RSD of the observed CCS values observed in multiple runs is small (<1%), then the mean CCS obtained from multiple runs is expected to be close to the true value. Based on this assumption, the mean measured CCS value of all compound having an RSD <1% were retained; hereafter referred to as the “experimental reference CCS value” (positive ion mode: 339 compounds; negative ion mode: 92 compounds) served as the reference criterion for subsequent evaluation and analysis of CCS prediction accuracy.
CCSondemand and the public CCS prediction tool were used to predict CCS values of [M+H]+ ions for the 339 compounds detected in positive ion mode. Each predicted CCS value was compared with the experimental reference value, and the relative deviation calculated. Table 3 lists the standard deviations (SDs) of the relative deviations in CCS that were predicted by the two prediction tools, as well as the corresponding probability levels. Their normal distributions are shown in Figure 3. The probability level of the values included within the normal distribution analysis falling within the mean ±1 x SD equals 68%, i.e., 68% of values in the array are within mean ±1 x SD. Similarly, 95% of the values are within the mean ±2 x SD, and 99.7% of the values are within the mean ±3 x SD.
In summary, it can be concluded, from the results shown in Table 3 and the normal distributions in Figure 3 that: 1) in positive-ion ionization mode, most of the CCS values predicted by either of the prediction tools were accurate enough to serve as reference and guidance for the qualitative analysis to some extent; 2) in the case of the public CCS prediction tool, predicted CCS values of 99.7% of the compounds had relative deviations within ±10% compared to the experimental reference values, while in the case of CCSondemand, 99.7% of the compounds had relative deviations within ±5%. In other words, CCSondemand showed relatively small error in CCS prediction vs. experimental values, as demonstrated by the relative deviations distributions in shown in Figure 4.
In addition, linear regression analysis was performed between the predicted CCS values of the 339 compounds and the experimental reference values. The regression curves and corresponding linear correlation coefficients are shown in Figure 5. The distribution of the data points and the linear regression coefficients further indicated good fit between the predicted CCS values and the experimental reference values.
Two compounds, chlorsulfuron and hydramethylnon, which were detected in both positive ion mode and negative ion mode, are highlighted using green and purple dots respectively. These examples are discussed in more detail in the section ‘Examples of Compound Data Analysis’.
Likewise, an overall analysis of the predicted CCS values, experimental reference values, and relative deviations in predictions was performed for the 92 compounds detected in negative ion mode. Figure 6 shows linear regression curves of the predicted CCS values vs. experimental reference values in negative ion mode, illustrating similar performance metrics for both models compared to the positive ionization mode results.
Confirmation of compound identification was achieved by reviewing raw data and the qualitative UNIFI analysis results of chlorsulfuron (green dot Figures 5 and 6) in both positive and negative ion modes from the same analysis batch [exemplified by run No. 16 in Table 1 and run No. 8 in Table 2]. All data shown were acquired in resolution mode on a SYNAPT G2-Si instrument using an XSelect HSS T3 Column. Figure 7 shows the chromatograms (left) and arrival time distribution (ATD) (right) of chlorsulfuron in positive and negative ion modes. Since the same column and chromatographic conditions were used, the chromatographic behavior of the compound in positive ion mode and negative ion mode are expected to be similar. This assumption was verified by the identical retention time and peak shape in both ionization modes, further confirming the correct detection of this compound. The CCS values differ slightly due to the different ion adducts.
Table 4 lists the CCS values of chlorsulfuron from multiple injections observed in positive ion mode on the left, and those obtained in negative ion mode on the right. The values in blue font are mean measured CCS values from multiple analyses, i.e., the aforementioned experimental reference values.
Chromatograms, mobility distributions, and measured CCS values of hydramethylnon (purple dot in Figures 5 and 6) are shown in Figure 8 and Table 5, respectively. The data is derived from the same dataset as the chlorsulfuron analysis. An overlapping peak appeared in the ATD (positive ion mode) as illustrated in Figure 8 and was confirmed to be caused by isomerism.
The ATD peak widths of this compound in positive-ion and negative-ion ionization modes differ greatly with the ATD peak in positive ion mode evidently broadening. The mobility heatmap (data not shown) confirmed that the broadening was mainly caused by mobility peak tailing due to abundant signals.
CCSondemand and the public CCS prediction tool were used to predict CCS values of [M+H] and [M-H] ions of both compounds under investigation, as shown in Table 6.
From the data in Table 6 it can be concluded:
In conclusion, for both CCS prediction tools, most predicted CCS values were sufficiently accurate to serve as reference and guidance for the qualitative analysis. However, the accuracy of CCS predictions for some compounds needs further development, and the overall performance of the prediction tools to be modified and perfected, which is expected to occur over time.
In this study, we performed an overall evaluation of a research prototype CCS prediction tool CCSondemand, in terms of the accuracy of predicted CCS values under variable experimental conditions. The evaluation was based on hundreds of pesticide compounds serving as test sample, and their mean measured CCS values obtained via multiple injections used as reference values, with CCS predictions typically taking <1 s per compound. The results were compared with those obtained with a publicly available CCS prediction tool. The results showed that the CCS prediction accuracy of CCSondemand was good and has potential to improve the characterization of unknowns.
As scientists continuously increase their understanding of the ion mobility principle, hardware innovations are made, and data acquisition methods are constantly updated. As a consequence, analytical experiments with larger data sets are produced. Alongside this CCS prediction techniques will most likely mature, and their prediction accuracy and reliability expected to gradually improve. Eventually, such techniques could become powerful qualitative analytical tools for analytical chemistry researchers.
720007021, November 2020