Simultaneous Analysis of Cyclosporine, Everolimus, Sirolimus, and Tacrolimus in Whole Blood for Clinical Research
For research use only. Not for use in diagnostic procedures.
Abstract
This application note describes, a clinical research method which uses a simple and fast protein precipitation of a small volume of human whole blood.
Benefits
- Analytical selectivity afforded by chromatography and highly selective mass detection
- Simple and inexpensive sample preparation using low sample volume
- Fast analytical run time, with simultaneous analysis of four analytes
Introduction
High inter and intra-individual pharmacokinetic variability of the immunosuppressive agents cyclosporine, everolimus, sirolimus, and tacrolimus is known.1 As such, an accurate, analytically sensitive method may be of utility in researching pharmacokinetic and pharmacodynamic effects of their administration.
Here we describe a clinical research method using a simple and fast protein precipitation of a small volume of human whole blood. Chromatographic elution using a Waters™ ACQUITY™ UPLC™ HSS C18 SB Column on a Waters ACQUITY UPLC I-Class with FL System was completed within 1.5 minutes. Simultaneous analysis of all four analytes, followed by detection on a Xevo™ TQ-S micro Mass Spectrometer (Figure 1) was achieved with a time of under two minutes from injection-to-injection.
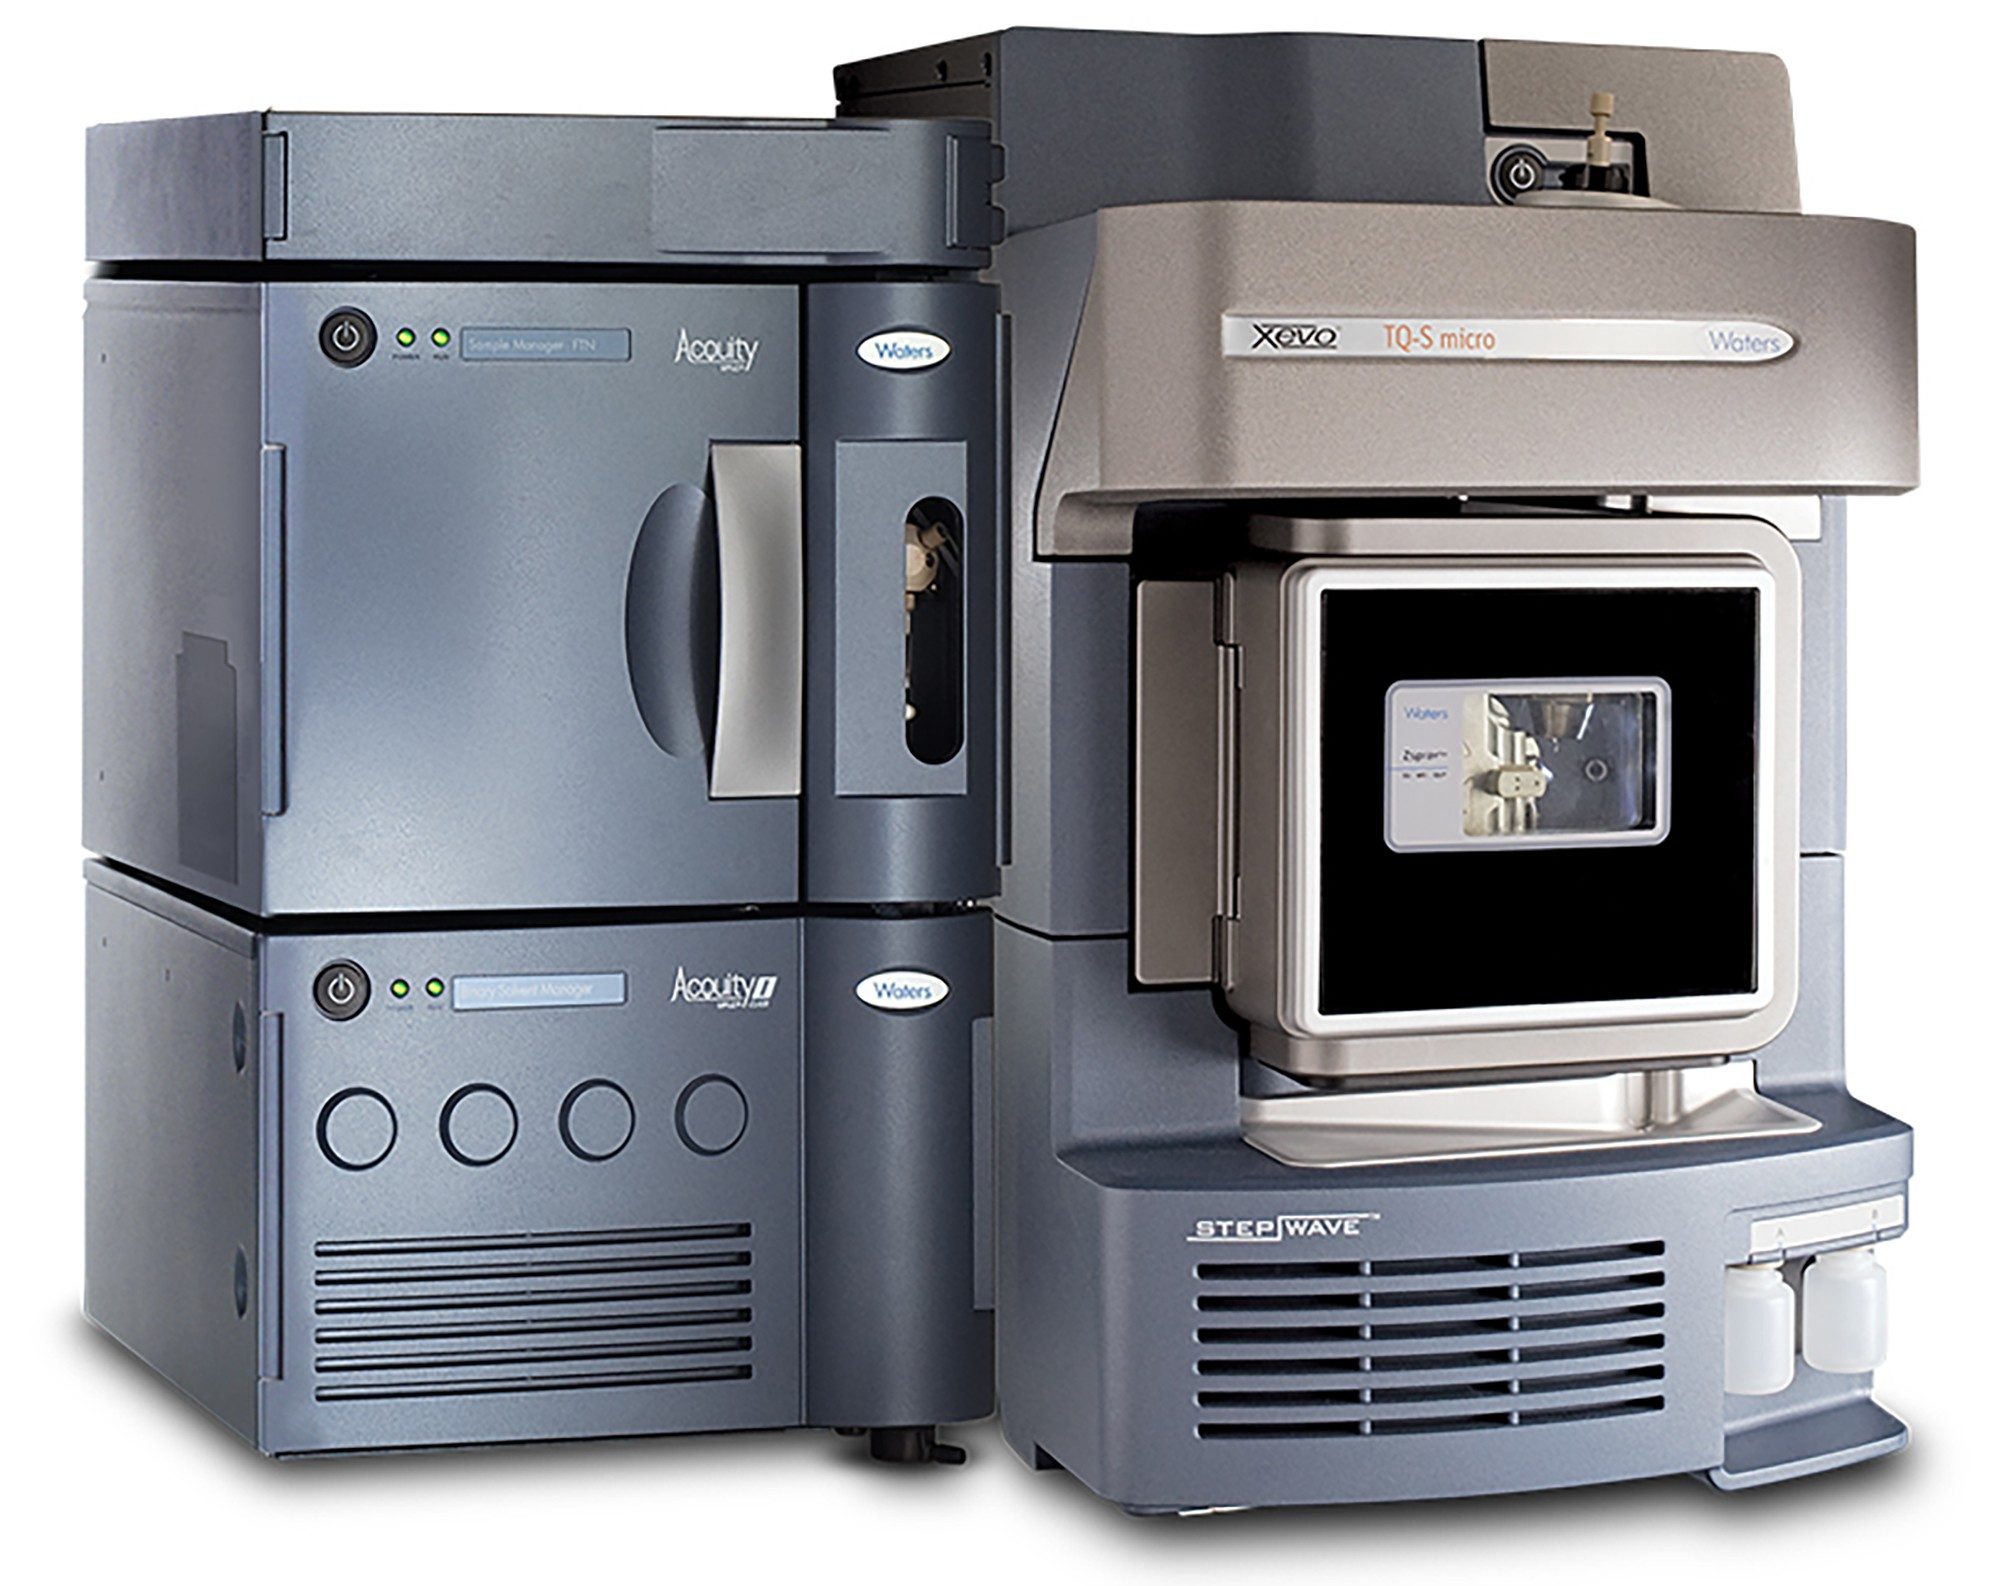 Figure 1. The Waters ACQUITY UPLC I-Class with FL System and Xevo TQ-S micro Mass Spectrometer.
Experimental
Sample Preparation
Whole blood calibrators and quality control materials containing cyclosporine, everolimus, sirolimus, and tacrolimus were used. Respectively, 2H12-cyclosporine, 13C22H4-everolimus, 2H3-sirolimus, and ascomycin were used as internal standards.
The calibrator and QC concentrations (at low, medium, and high concentrations) are detailed in Table 1.
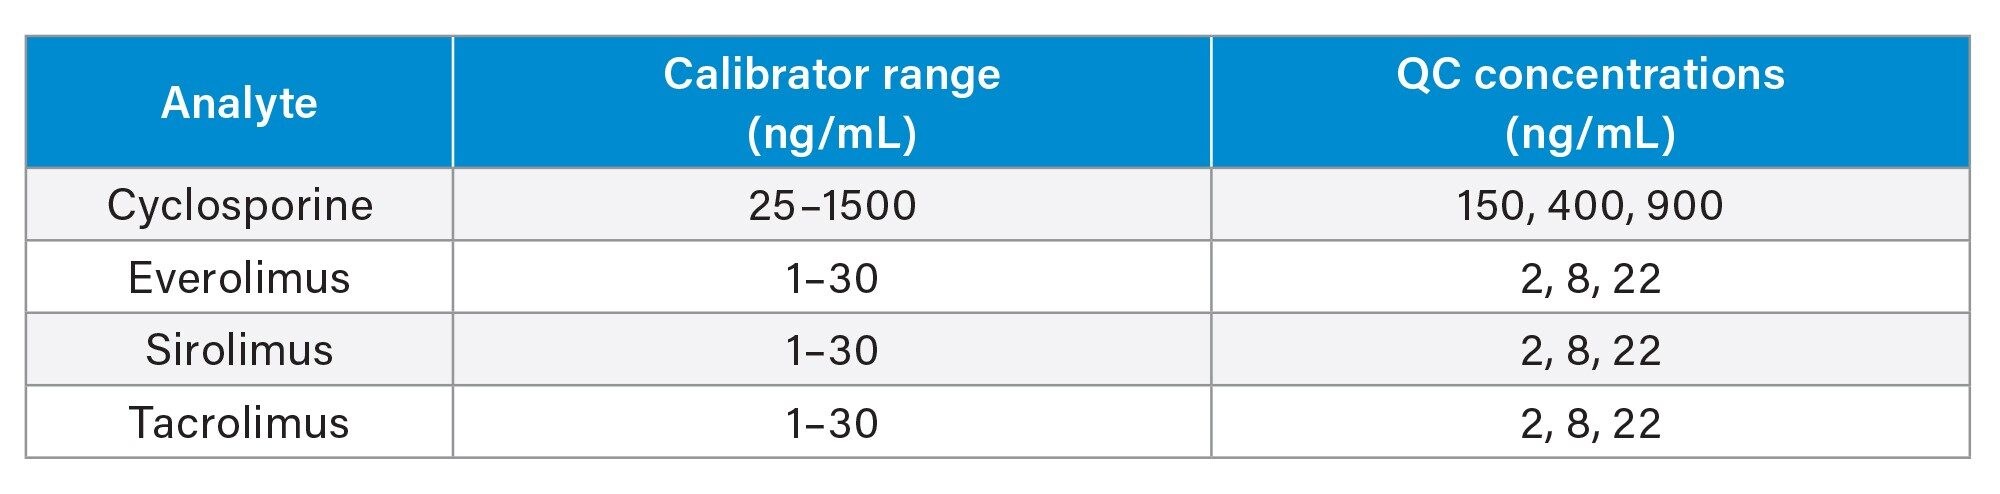 Table 1. Calibrator and QC concentrations.
Sample Extraction
Pipette 50 µL sample into a 2 mL, 96-well sample collection plate (p/n: 186002482). Add 200 µL 0.1 M ZnSO4(aq), vortex mix, then add 500 µL of internal standard (ISTD) in acetonitrile and vortex mix. Centrifuge the plate for two minutes at 4,696 g and analyze the supernatant.
UPLC Conditions
|
System: |
ACQUITY UPLC I-Class with FL |
|
|
Needle: |
20 µL |
|
|
Loop: |
50 µL |
|
|
Column: |
ACQUITY UPLC HSS C18 SB Column; 1.8 µm, 2.1 x 30 mm (p/n: 186004117) |
|
|
Column temperature: |
55 °C |
|
|
Sample temperature: |
8 °C |
|
|
Injection volume: |
20 µL |
|
|
Injection mode: |
PLNO, with Load Ahead enabled |
|
|
Mobile phase A: |
Water + 2 mM ammonium acetate + 0.1% formic acid |
|
|
Mobile phase B: |
Methanol + 2 mM ammonium acetate + 0.1% formic acid |
|
|
Weak wash: |
Water:methanol 95:5 (v:v), 600 µL |
|
|
Strong wash: |
Water:methanol:acetonitrile:IPA 1:1:1:1 (v:v:v:v), 200 µL |
|
|
Seal wash: |
Water:methanol 80:20 (v:v) |
|
|
Run time: |
1.5 minutes (1.9 minutes injection-to-injection) |
|
|
Gradient elution: |
Table 2 |
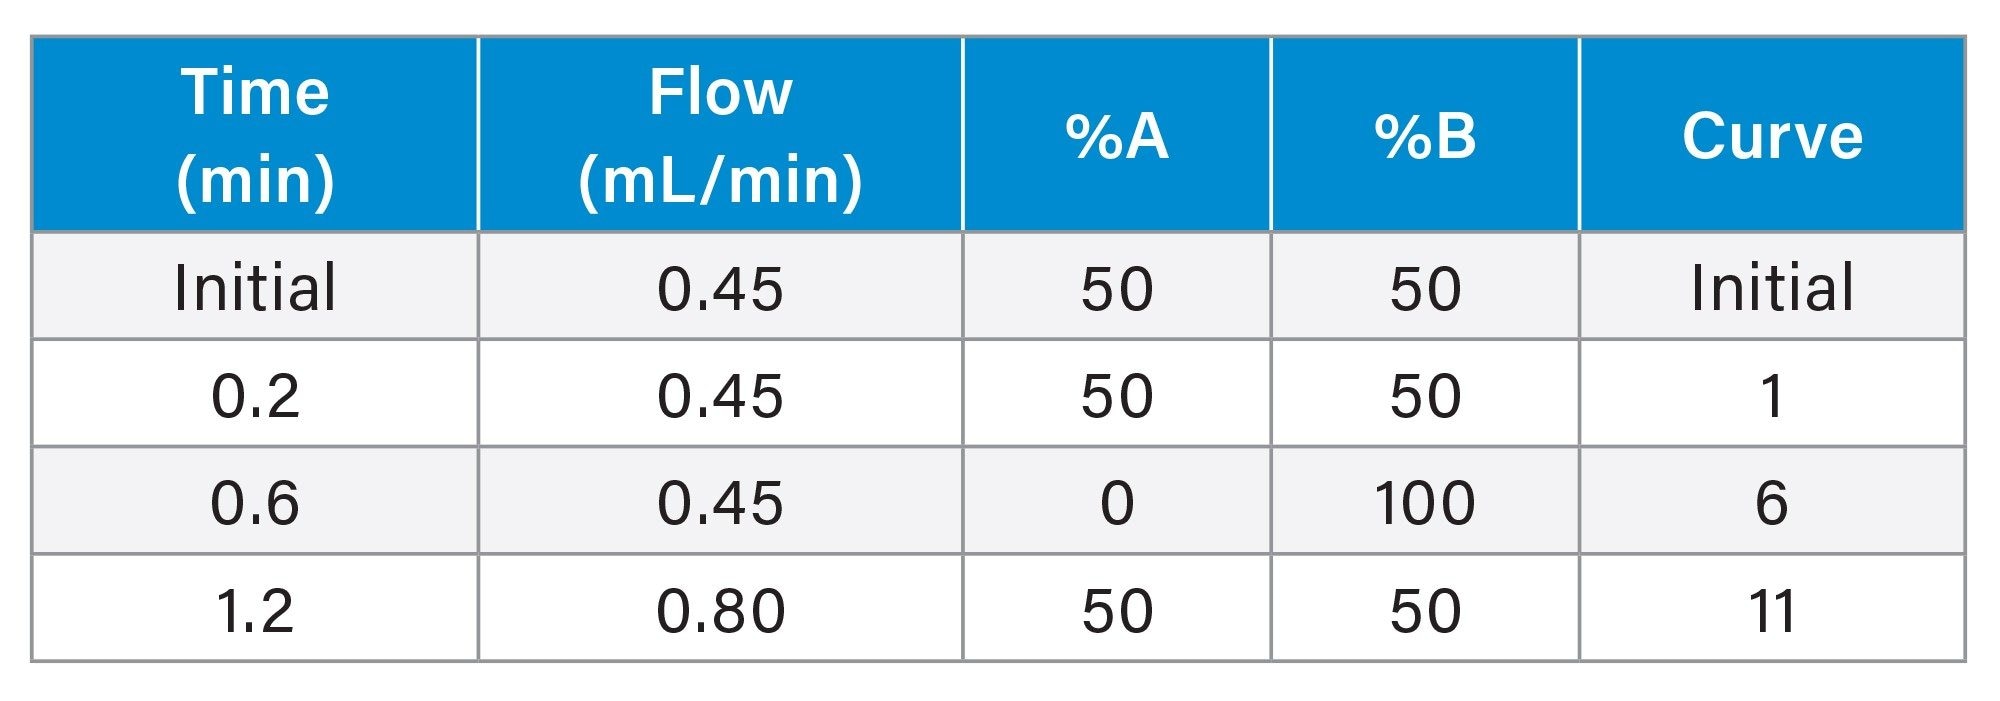 Table 2. Gradient for immunosuppressants analysis.
MS Conditions
|
System: |
Xevo TQ-S micro |
|
|
Resolution: |
MS1 (0.7 FWHM) MS2 (0.7 FWHM) |
|
|
Acquisition mode: |
Multiple Reaction Monitoring (MRM) (see Table 3 for details) |
|
|
Polarity: |
ESI+ |
|
|
Capillary: |
0.8 kV |
|
|
Source temperature: |
120 °C |
|
|
Desolvation temperature: |
400 °C |
|
|
Inter-scan delay: |
0.01 seconds |
|
|
Inter-channel delay: |
0.01 seconds |
Data Management
|
Data management: |
MassLynx™ v4.2 with TargetLynx XS™ Application Manager |
MRM Parameters
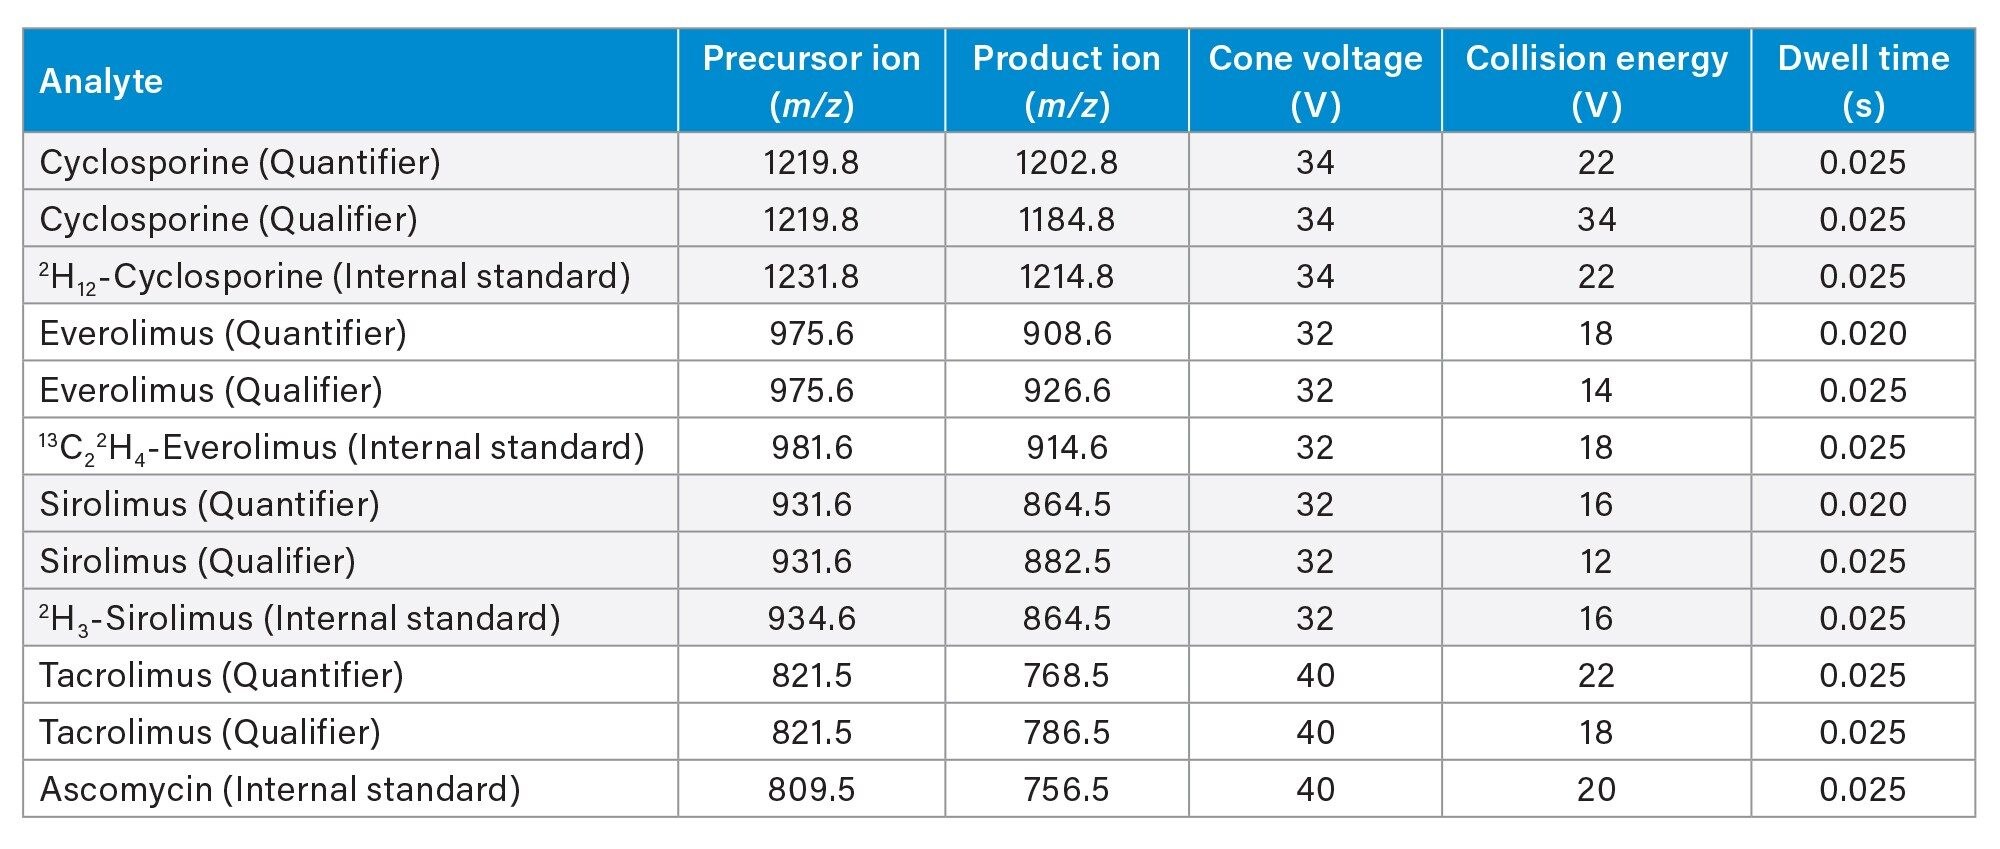 Table 3. Guideline MRM parameters for analytes and internal standards used in this study.
Results and Discussion
Figure 2 shows an example chromatogram of calibrator 1 (25 ng/mL cyclosporine and 1 ng/mL everolimus, sirolimus, and tacrolimus).
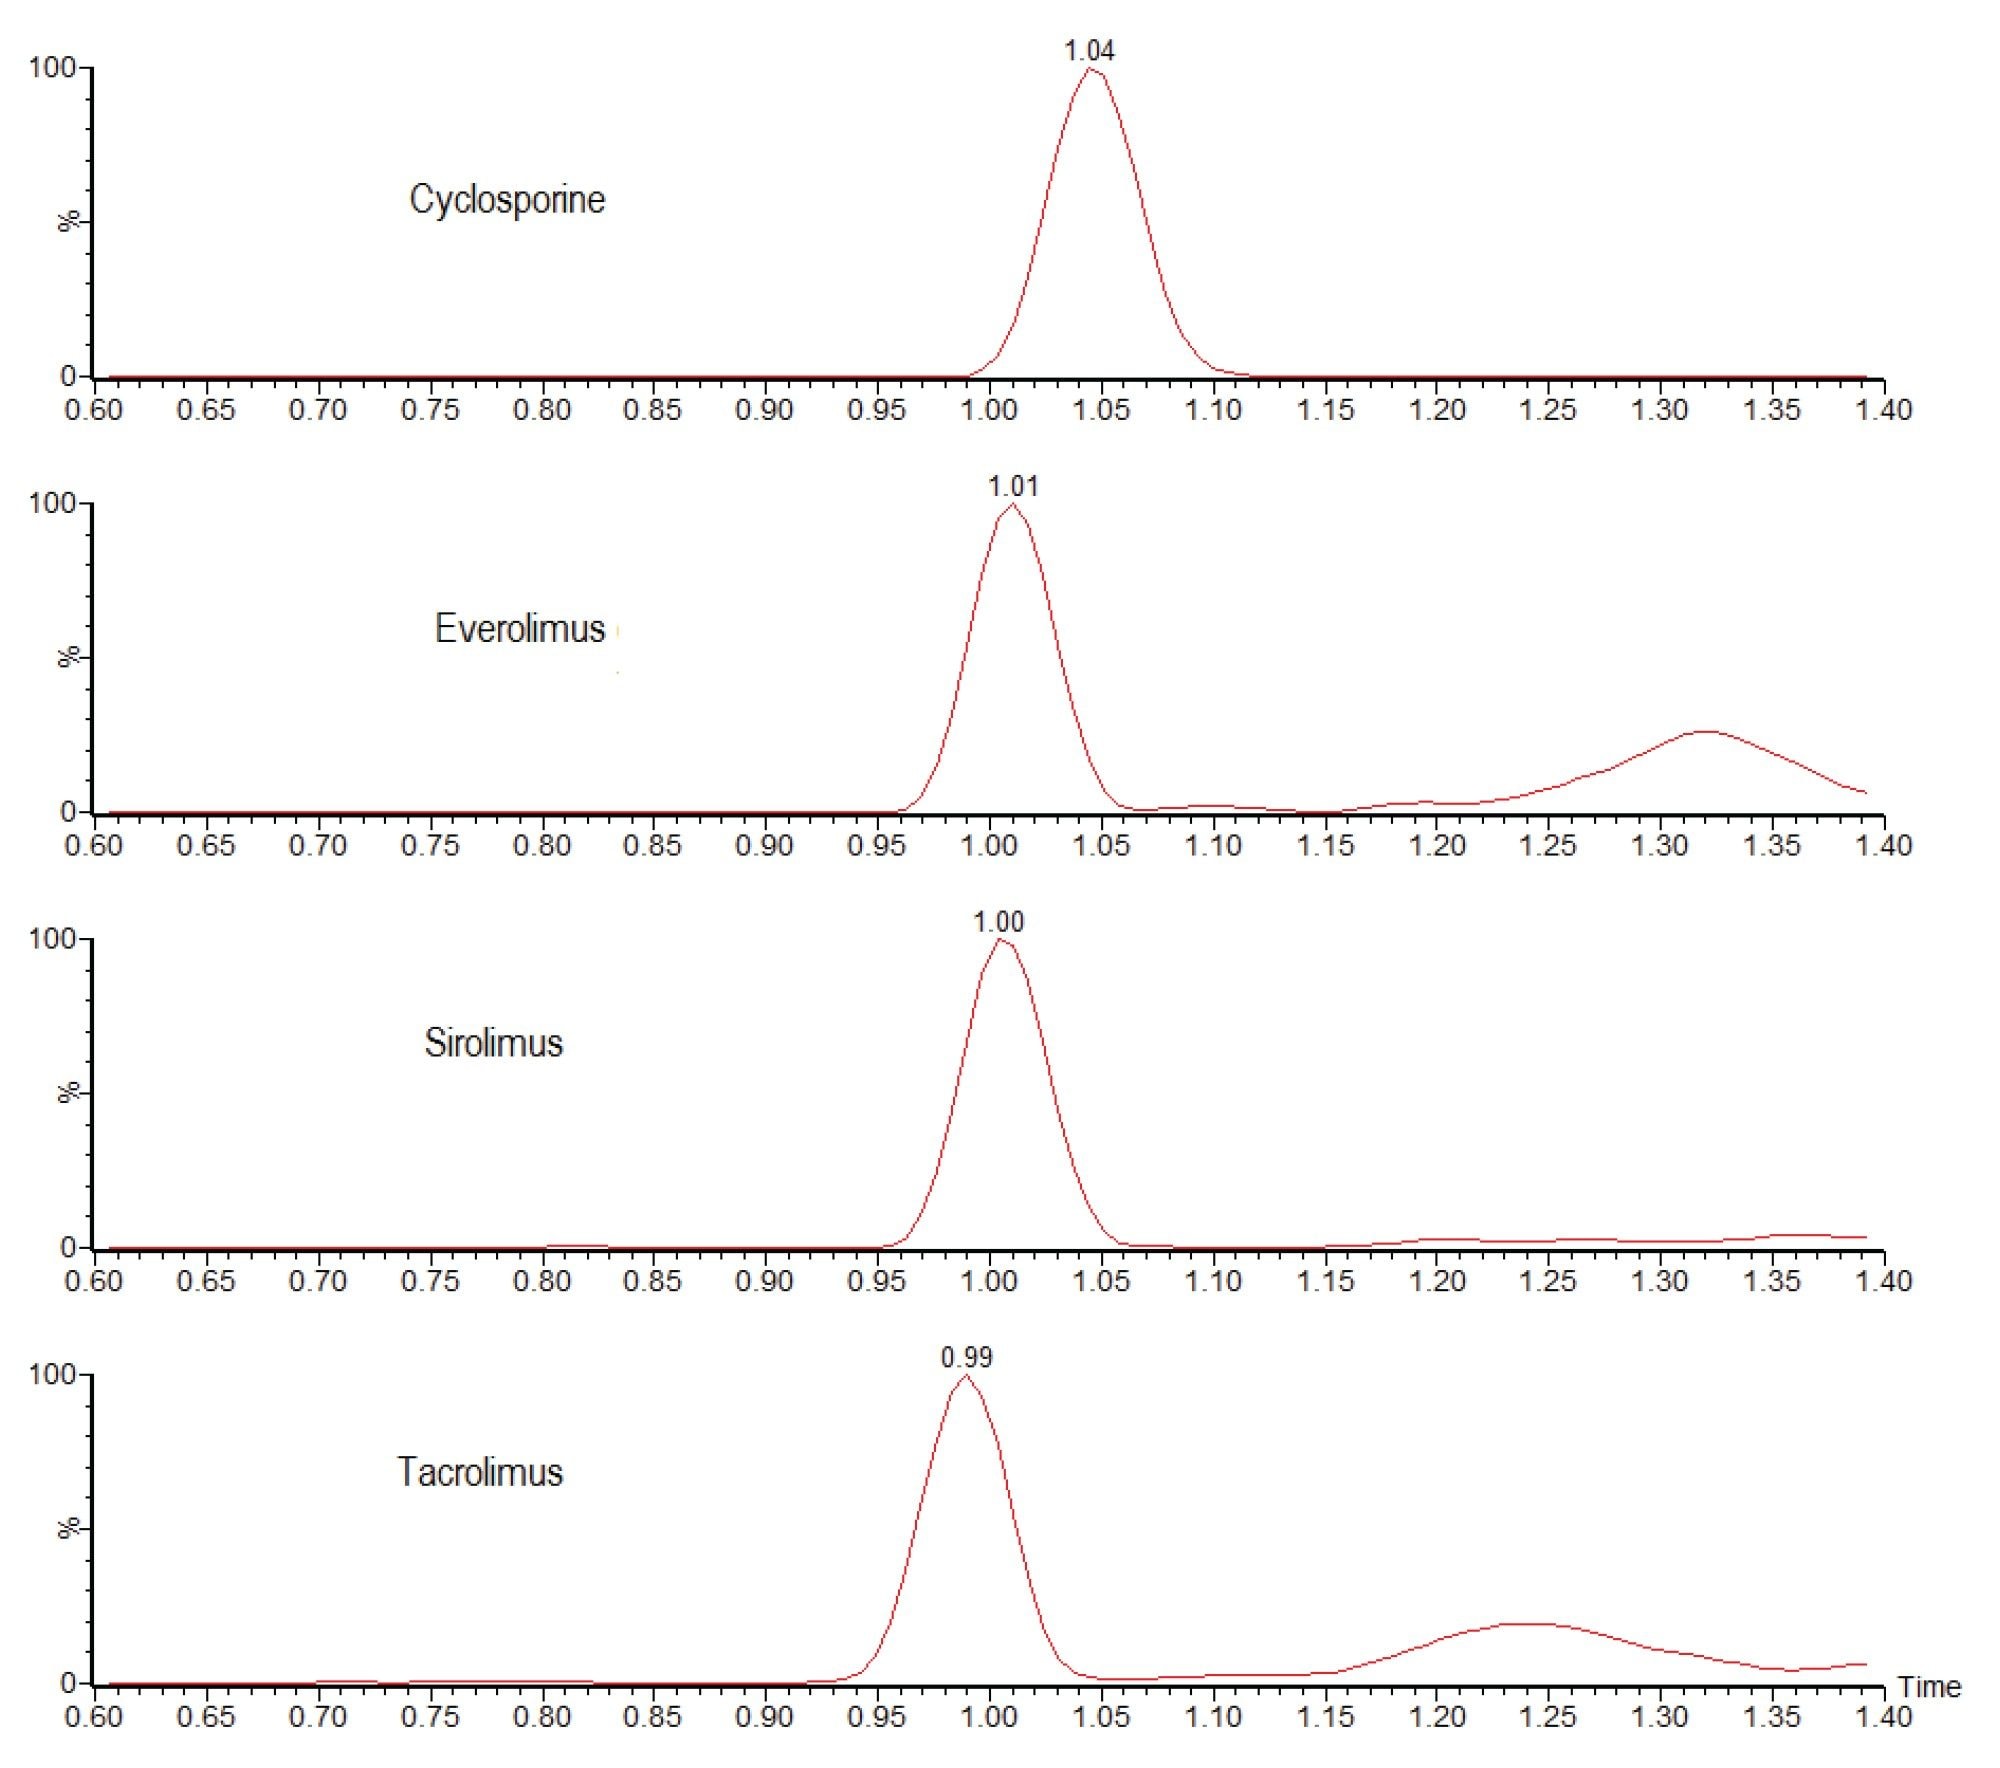 Figure 2. Chromatograms showing the analysis of 25 ng/mL cyclosporine and 1 ng/mL everolimus, sirolimus, and tacrolimus using the ACQUITY UPLC I-Class with FL/ Xevo TQ-S micro IVD System.
No system carryover was observed following analysis of whole blood samples with 3000 ng/mL of cyclosporine and 60 ng/mL of everolimus, sirolimus, and tacrolimus.
Analytical sensitivity was assessed by extracting and quantifying 10 replicates of low concentration samples prepared in whole blood over five days (n=50). Investigations indicated the method would allow for precise quantification (≤20% CV, ≤15% bias) at the concentrations shown in Table 4.
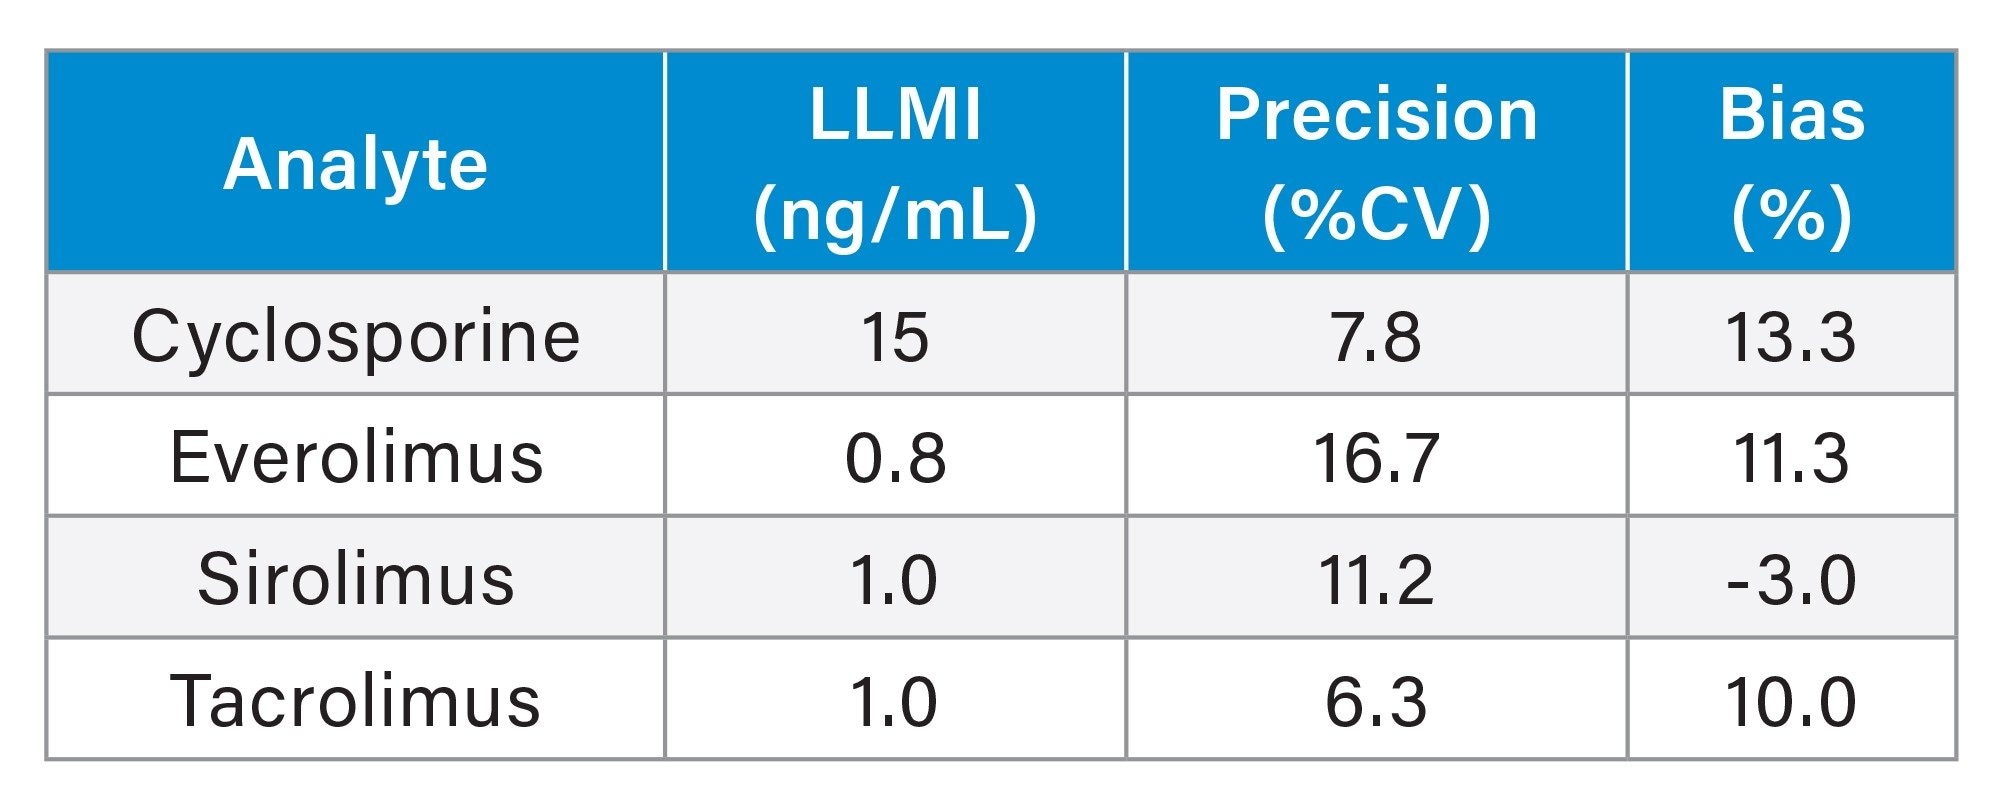 Table 4. Analytical sensitivity summary (LLMI is lower limit of the measuring interval).
Total precision was determined by extracting and quantifying five replicates of three concentrations of whole blood pools over five separate days (n=25). Repeatability was assessed by analyzing five replicates at each QC level. Table 5 presents results of these experiments, where total precision and repeatability at the three concentrations assessed was ≤8.4% RSD.
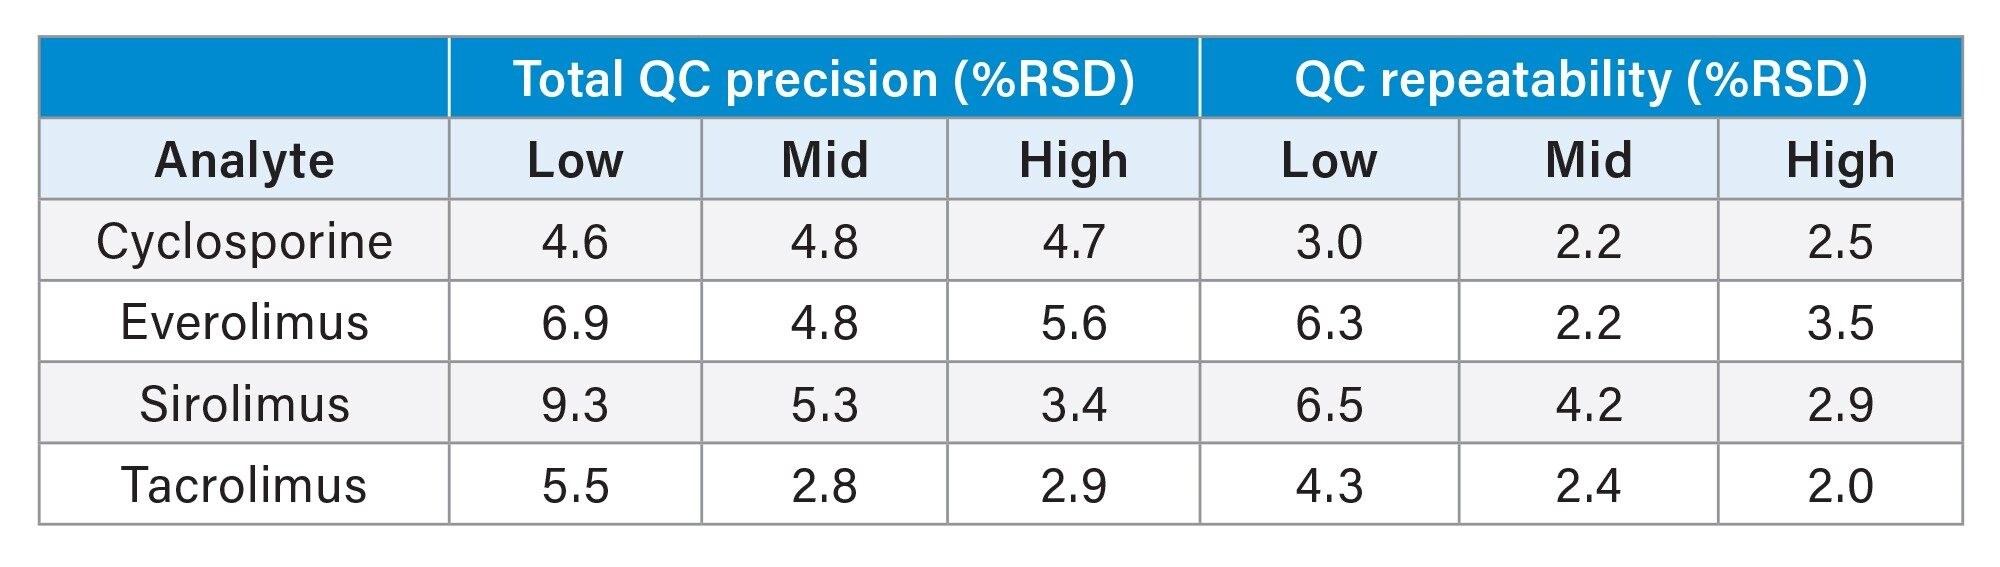 Table 5. Total precision and repeatability performance.
The method was shown to be linear over the ranges of 19.3–1500 ng/mL for cyclosporine and 0.77–39.0 ng/mL for everolimus, sirolimus, and tacrolimus when different ratios of high and low concentration whole blood pools were combined and analysed.
Biases of ≤10.4% were achieved after 1:1 dilution (using blank whole blood) of high concentration samples to be within the calibration ranges of the method.
Recoveries (extraction efficiency) over the QC concentrations ranged from 93.2–108.4%.
Matrix effects were evaluated at low and high QC concentrations in whole blood (n=5) taken as a percentage of extracted solvent samples spiked to equivalent concentrations. Calculation using analyte:internal standard response ratio indicated compensation for signal enhancement or suppression by the internal standard (Table 6).
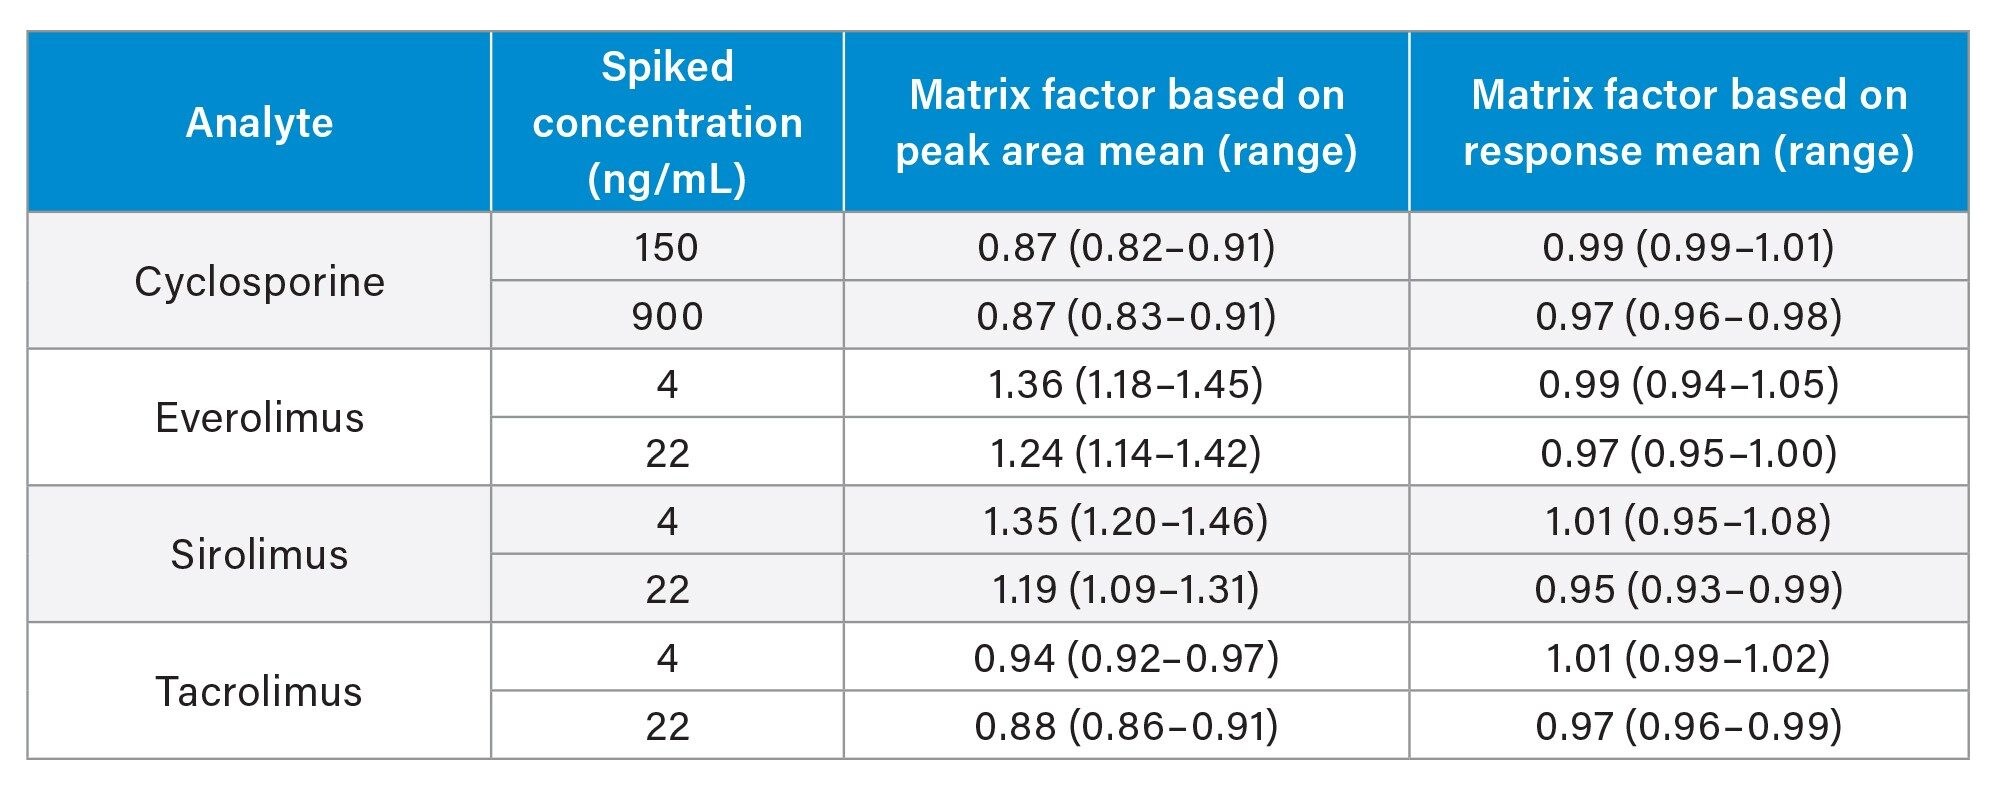 Table 6. Quantitative matrix effects summary.
Additionally, post-column infusion experiments showed that analytes eluted in regions free of significant ion enhancement or suppression.
Potential interference from endogenous compounds (albumin, bilirubin, cholesterol, creatinine, triglycerides, and uric acid) spiked at high concentrations was assessed by determining the recovery (n=3) from low and high pooled whole blood samples (150 and 900 ng/mL cyclosporine, 4 and 22 ng/mL everolimus, sirolimus, and tacrolimus). All recoveries were within the range 85–115%, with the exception of albumin supplemented at 120 mg/mL, for which 84.1–115% was achieved.
LGC (Bury, UK) whole blood External Quality Assurance samples were sourced and analysed to assess method accuracy. A summary is presented in Table 7.
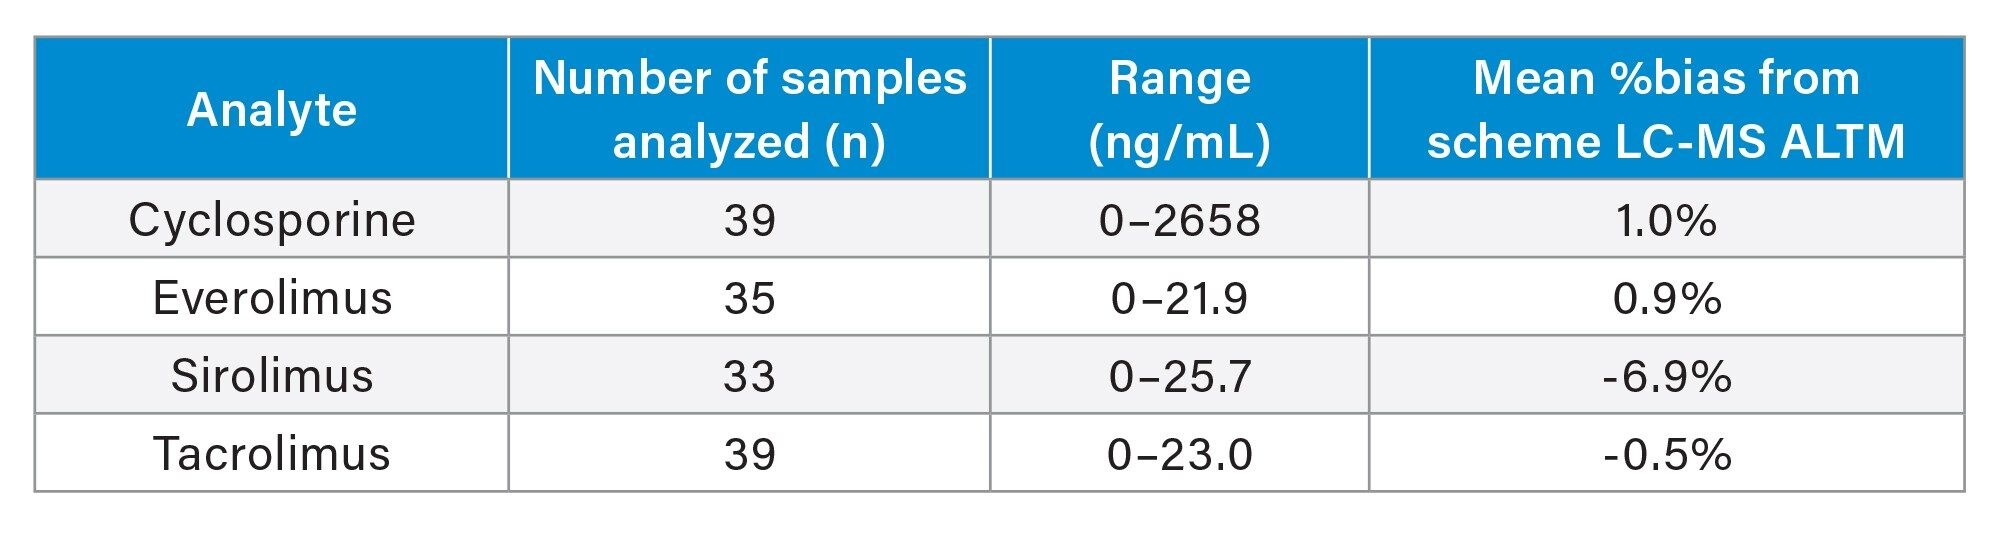 Table 7. Accuracy summary (Note: ALTM is the all-laboratory trimmed mean).
Conclusion
Simultaneous analysis of the immunosuppressant drugs cyclosporine, everolimus, sirolimus, and tacrolimus can be achieved in a single analysis of under two minutes (injection-to-injection), from a fast and inexpensive sample preparation procedure using only 50 µL of whole blood.
The performance characteristics of the method indicate good analytical sensitivity, total precision, and repeatability (≤8.4% RSD) across all analytes and concentrations tested. Matrix effects were compensated through the use of the internal standards and no carryover was observed.
In addition, good agreement was obtained when analysing EQA samples, providing confidence in the accuracy of the method.
References
- Crossart A, Isbel M, Schuder C, Campbell SB, and Staatz CE. Pharmacokinetic and Pharmacodynamic Considerations in Relation to Calcineurin Usage in Elderly Kidney Transplant Recipients. Frontiers in Pharmacology. April 2021; Volume 12; Article 635165.
720007586, April 2022